

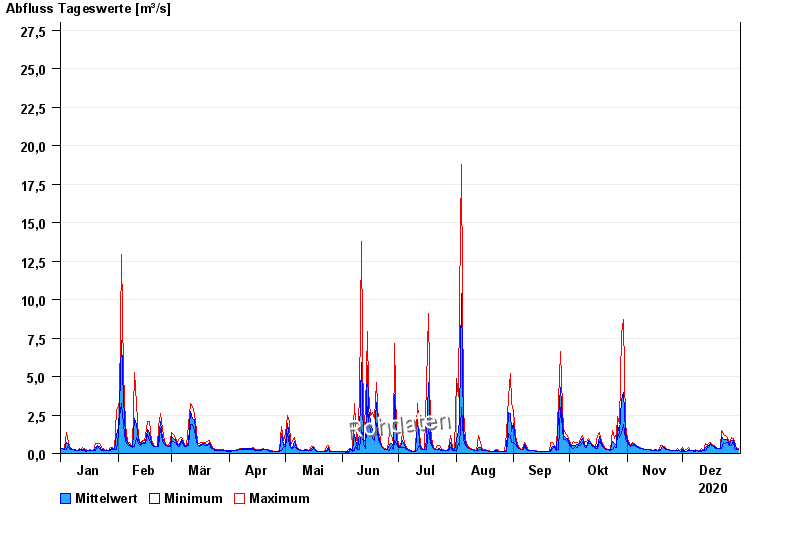
Chart of year Winkel / Starzlach
Discharge from 01.01.2020 to 31.12.2020
- 25.06.1955 Abfluss: 101 m³/s
- 22.05.1999 Abfluss: 88,8 m³/s
- 10.08.1970 Abfluss: 55,1 m³/s
- 23.08.2005 Abfluss: 48,9 m³/s
- 22.08.2005 Abfluss: 41,1 m³/s
| Date | Mean value [m³/s] | Maximum [m³/s] | Minimum [m³/s] |
|---|---|---|---|
| 31.12.2020 | 0.277 | 0.293 | 0.261 |
| 30.12.2020 | 0.3 | 0.328 | 0.261 |
| 29.12.2020 | 0.572 | 0.799 | 0.293 |
| 28.12.2020 | 0.843 | 0.968 | 0.799 |
| 27.12.2020 | 0.818 | 1.06 | 0.546 |
| 26.12.2020 | 0.599 | 0.729 | 0.494 |
| 25.12.2020 | 0.909 | 1.06 | 0.729 |
© Bayerisches Landesamt für Umwelt 2025