

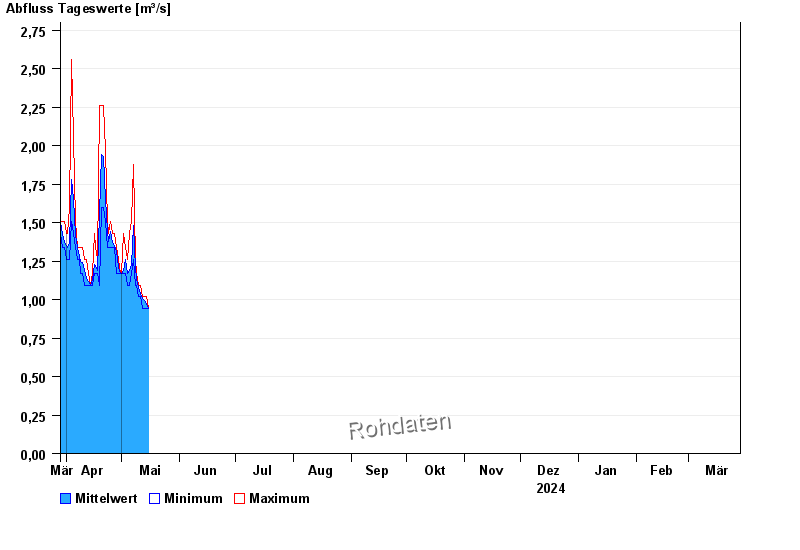
Chart of year Wirsberg / Schorgast
Discharge from 29.03.2024 to 28.03.2025
| Date | Mean value [m³/s] | Maximum [m³/s] | Minimum [m³/s] |
|---|---|---|---|
| 16.10.2024 | 0.633 | 0.725 | 0.546 |
| 15.10.2024 | 0.699 | 0.929 | 0.604 |
| 14.10.2024 | 0.739 | 0.858 | 0.604 |
| 13.10.2024 | 0.879 | 1.24 | 0.725 |
| 12.10.2024 | 0.828 | 1 | 0.725 |
| 11.10.2024 | 1.07 | 1.49 | 0.663 |
| 10.10.2024 | 0.717 | 0.929 | 0.604 |
© Bayerisches Landesamt für Umwelt 2024