
- Start >
- Rivers >
- Discharge >
- Oberer Main - Elbe >
- Bad Berneck >
- Chart of year

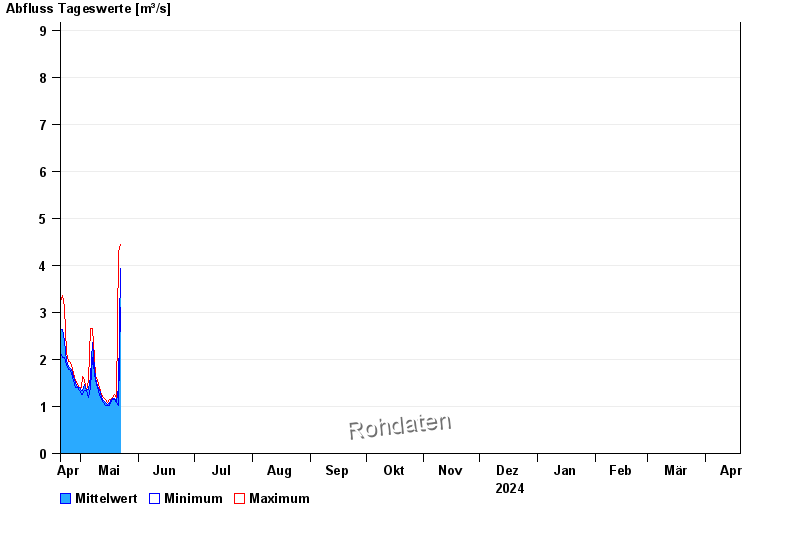
Chart of year Bad Berneck / Ölschnitz
Discharge from 20.04.2024 to 19.04.2025
- HQ1 13 m³/s
- HQ2 17 m³/s
- HQ5 23 m³/s
- HQ10 27 m³/s
- HQ20 32 m³/s
- HQ50 38 m³/s
- HQ100 45 m³/s
| Date | Mean value [m³/s] | Maximum [m³/s] | Minimum [m³/s] |
|---|---|---|---|
| 08.08.2024 | 0.76 | 0.795 | 0.747 |
| 07.08.2024 | 0.806 | 0.89 | 0.704 |
| 06.08.2024 | 0.878 | 0.941 | 0.839 |
| 05.08.2024 | 1.07 | 1.23 | 0.89 |
| 04.08.2024 | 1.72 | 3.05 | 0.89 |
| 03.08.2024 | 0.965 | 1.11 | 0.89 |
| 02.08.2024 | 1.13 | 1.44 | 0.994 |
© Bayerisches Landesamt für Umwelt 2024