
- Start >
- Rivers >
- Discharge >
- Oberer Main - Elbe >
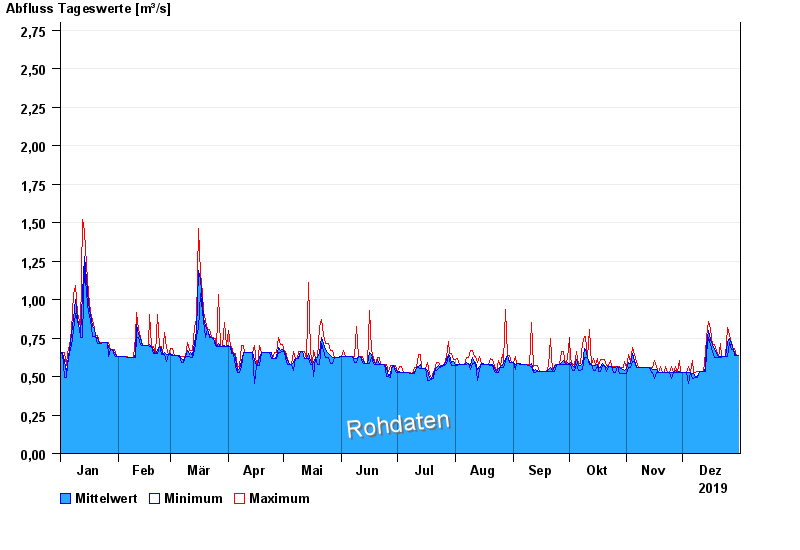
- Bärenthal >
- Chart of year

Chart of year Bärenthal / Trubach
Discharge from 01.01.2019 to 31.12.2019
- 01.03.1956 Abfluss: 12 m³/s
- 01.02.1950 Abfluss: 7,4 m³/s
- 01.03.1955 Abfluss: 5,2 m³/s
- 22.12.1991 Abfluss: 3,48 m³/s
- 20.07.2011 Abfluss: 3,42 m³/s
| Date | Mean value [m³/s] | Maximum [m³/s] | Minimum [m³/s] |
|---|---|---|---|
| 31.12.2019 | 0.638 | 0.639 | 0.638 |
| 30.12.2019 | 0.637 | 0.638 | 0.636 |
| 29.12.2019 | 0.653 | 0.679 | 0.636 |
| 28.12.2019 | 0.678 | 0.678 | 0.677 |
| 27.12.2019 | 0.717 | 0.722 | 0.677 |
| 26.12.2019 | 0.749 | 0.769 | 0.721 |
| 25.12.2019 | 0.722 | 0.819 | 0.63 |
© Bayerisches Landesamt für Umwelt 2025