
- Start >
- Rivers >
- Discharge >
- Oberer Main - Elbe >
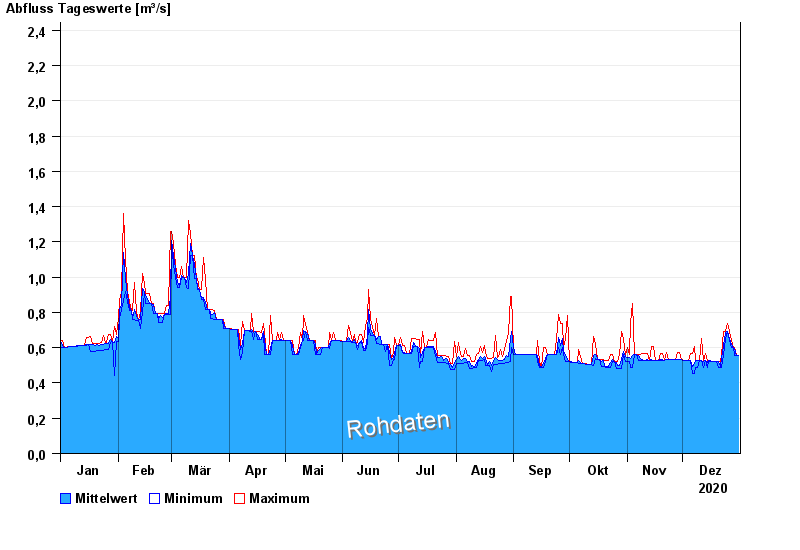
- Bärenthal >
- Chart of year

Chart of year Bärenthal / Trubach
Discharge from 01.01.2020 to 31.12.2020
- 22.12.1991 Abfluss: 3,88 m³/s
- 26.01.1995 Abfluss: 3,45 m³/s
- 20.07.2011 Abfluss: 3,26 m³/s
- 13.01.2011 Abfluss: 3,18 m³/s
- 20.03.2002 Abfluss: 3,14 m³/s
| Date | Mean value [m³/s] | Maximum [m³/s] | Minimum [m³/s] |
|---|---|---|---|
| 31.12.2020 | 0.557 | 0.557 | 0.557 |
| 30.12.2020 | 0.558 | 0.558 | 0.557 |
| 29.12.2020 | 0.596 | 0.599 | 0.558 |
| 28.12.2020 | 0.599 | 0.6 | 0.599 |
| 27.12.2020 | 0.62 | 0.643 | 0.6 |
| 26.12.2020 | 0.652 | 0.69 | 0.643 |
| 25.12.2020 | 0.691 | 0.739 | 0.69 |
© Bayerisches Landesamt für Umwelt 2025