
- Start >
- Rivers >
- Discharge >
- Oberer Main - Elbe >
- Bärenthal >
- Chart of year

Chart of year Bärenthal / Trubach
Discharge from 01.01.2021 to 31.12.2021
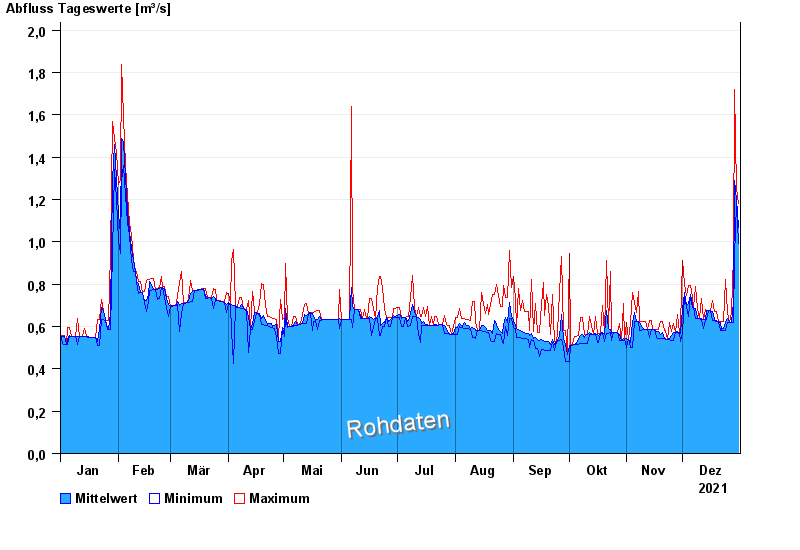
| Date | Mean value [m³/s] | Maximum [m³/s] | Minimum [m³/s] |
|---|---|---|---|
| 31.12.2021 | 1.07 | 1.18 | 0.991 |
| 30.12.2021 | 1.2 | 1.25 | 1.18 |
| 29.12.2021 | 1.29 | 1.72 | 0.933 |
| 28.12.2021 | 0.716 | 0.933 | 0.619 |
| 27.12.2021 | 0.621 | 0.666 | 0.62 |
| 26.12.2021 | 0.621 | 0.621 | 0.62 |
| 25.12.2021 | 0.637 | 0.667 | 0.621 |
© Bayerisches Landesamt für Umwelt 2025