
- Start >
- Rivers >
- Discharge >
- Oberer Main - Elbe >
- Birk >
- Chart of year

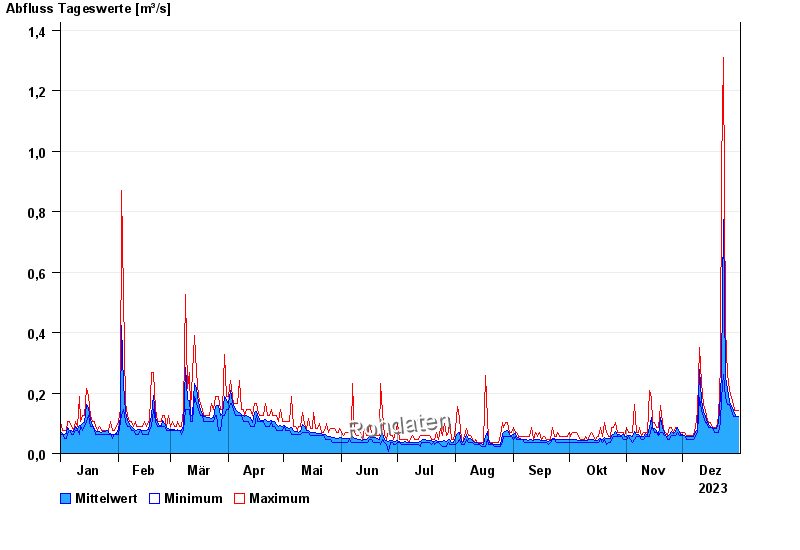
Chart of year Birk / Almosbach
Discharge from 01.01.2023 to 31.12.2023
| Date | Mean value [m³/s] | Maximum [m³/s] | Minimum [m³/s] |
|---|---|---|---|
| 31.12.2023 | 0.121 | 0.141 | 0.121 |
| 30.12.2023 | 0.124 | 0.141 | 0.121 |
| 29.12.2023 | 0.132 | 0.141 | 0.121 |
| 28.12.2023 | 0.141 | 0.162 | 0.121 |
| 27.12.2023 | 0.155 | 0.185 | 0.141 |
| 26.12.2023 | 0.171 | 0.21 | 0.162 |
| 25.12.2023 | 0.212 | 0.262 | 0.162 |
© Bayerisches Landesamt für Umwelt 2025