
- Start >
- Rivers >
- Discharge >
- Oberer Main - Elbe >
- Erbendorf >
- Chart of year

Chart of year Erbendorf / Fichtelnaab
Discharge from 01.01.2023 to 31.12.2023
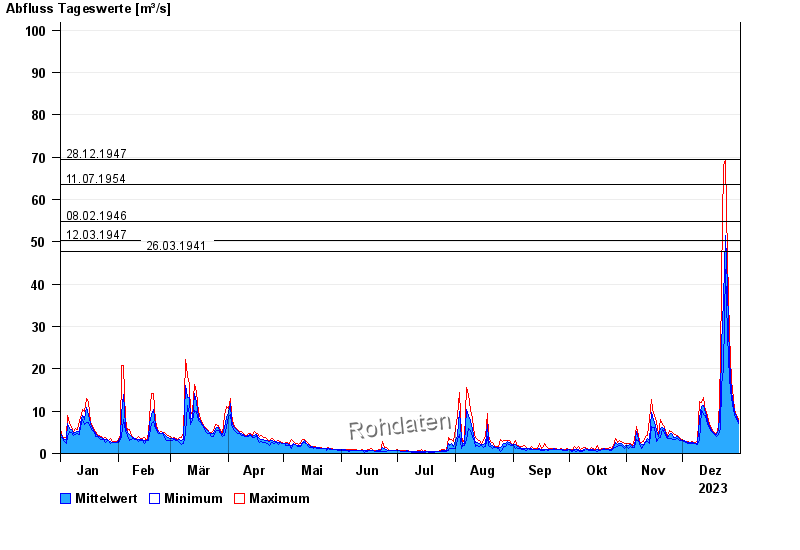
- 28.12.1947 Abfluss: 69,5 m³/s
- 11.07.1954 Abfluss: 63,6 m³/s
- 08.02.1946 Abfluss: 54,9 m³/s
- 12.03.1947 Abfluss: 50,4 m³/s
- 26.03.1941 Abfluss: 47,7 m³/s
| Date | Mean value [m³/s] | Maximum [m³/s] | Minimum [m³/s] |
|---|---|---|---|
| 31.12.2023 | 8.03 | 8.48 | 7.58 |
| 30.12.2023 | 9.04 | 9.42 | 8.48 |
| 29.12.2023 | 10.1 | 10.9 | 9.28 |
| 28.12.2023 | 11.9 | 13.3 | 10.9 |
| 27.12.2023 | 15 | 17.6 | 13.3 |
| 26.12.2023 | 22.3 | 28.7 | 17.6 |
| 25.12.2023 | 39.9 | 47.1 | 28.7 |
© Bayerisches Landesamt für Umwelt 2024