
- Start >
- Rivers >
- Discharge >
- Oberer Main - Elbe >
- Fahrenbühl >
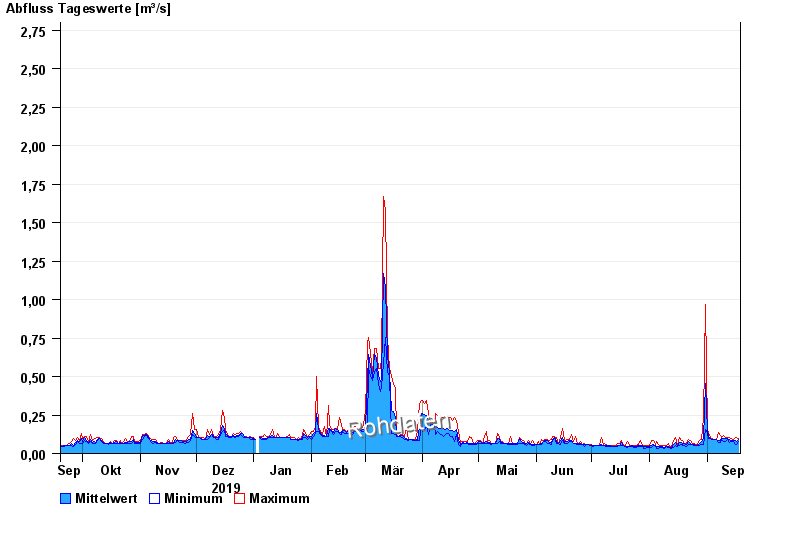
- Chart of year

Chart of year Fahrenbühl / Lamitz
Discharge from 19.09.2019 to 18.09.2020
note
Schlechte Netzanbindung
- 07.02.1984 Abfluss: 9,47 m³/s
- 23.01.1995 Abfluss: 8,61 m³/s
- 26.12.1974 Abfluss: 8,55 m³/s
- 04.08.1969 Abfluss: 8,35 m³/s
- 12.02.2005 Abfluss: 7,97 m³/s
| Date | Mean value [m³/s] | Maximum [m³/s] | Minimum [m³/s] |
|---|---|---|---|
| 18.09.2020 | 0.09 | 0.098 | 0.078 |
| 17.09.2020 | 0.081 | 0.107 | 0.06 |
| 16.09.2020 | 0.084 | 0.107 | 0.06 |
| 15.09.2020 | 0.082 | 0.088 | 0.078 |
| 14.09.2020 | 0.085 | 0.098 | 0.078 |
| 13.09.2020 | 0.09 | 0.107 | 0.069 |
| 12.09.2020 | 0.098 | 0.107 | 0.088 |
© Bayerisches Landesamt für Umwelt 2024