
- Start >
- Rivers >
- Discharge >
- Oberer Main - Elbe >
- Friedersdorf >
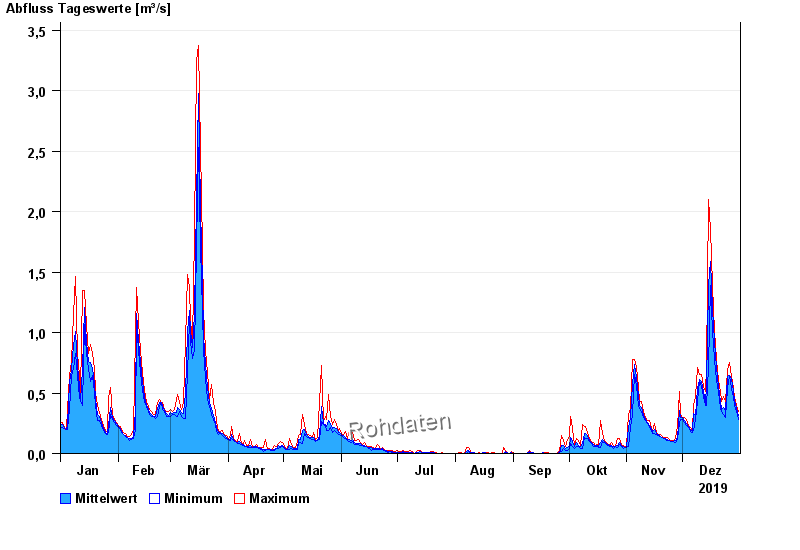
- Chart of year

Chart of year Friedersdorf / Buchbach
Discharge from 01.01.2019 to 31.12.2019
| Date | Mean value [m³/s] | Maximum [m³/s] | Minimum [m³/s] |
|---|---|---|---|
| 31.12.2019 | 0.311 | 0.349 | 0.28 |
| 30.12.2019 | 0.373 | 0.398 | 0.349 |
| 29.12.2019 | 0.441 | 0.46 | 0.398 |
| 28.12.2019 | 0.51 | 0.539 | 0.46 |
| 27.12.2019 | 0.609 | 0.634 | 0.539 |
| 26.12.2019 | 0.646 | 0.749 | 0.634 |
| 25.12.2019 | 0.634 | 0.69 | 0.539 |
© Bayerisches Landesamt für Umwelt 2024