
- Start >
- Rivers >
- Discharge >
- Oberer Main - Elbe >
- Kautendorf >
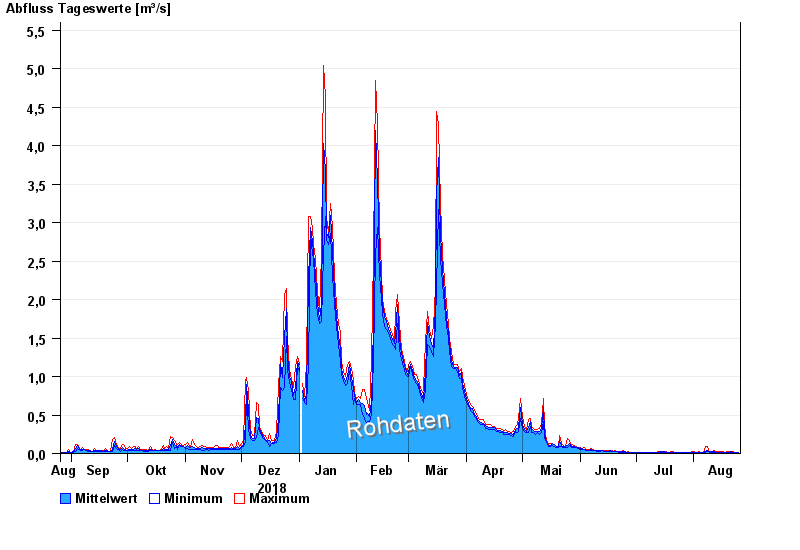
- Chart of year

Chart of year Kautendorf / Südliche Regnitz
Discharge from 26.08.2018 to 25.08.2019
note
| Date | Mean value [m³/s] | Maximum [m³/s] | Minimum [m³/s] |
|---|---|---|---|
| 25.08.2019 | 0.023 | 0.03 | 0.022 |
| 24.08.2019 | 0.023 | 0.029 | 0.022 |
| 23.08.2019 | 0.024 | 0.029 | 0.022 |
| 22.08.2019 | 0.028 | 0.029 | 0.022 |
| 21.08.2019 | 0.04 | 0.059 | 0.021 |
| 20.08.2019 | 0.024 | 0.029 | 0.021 |
| 19.08.2019 | 0.025 | 0.028 | 0.021 |
© Bayerisches Landesamt für Umwelt 2024