
- Start >
- Rivers >
- Discharge >
- Oberer Main - Elbe >
- Langenau >
- Chart of year

Chart of year Langenau / Langenaubach
Discharge from 24.10.2017 to 23.10.2018
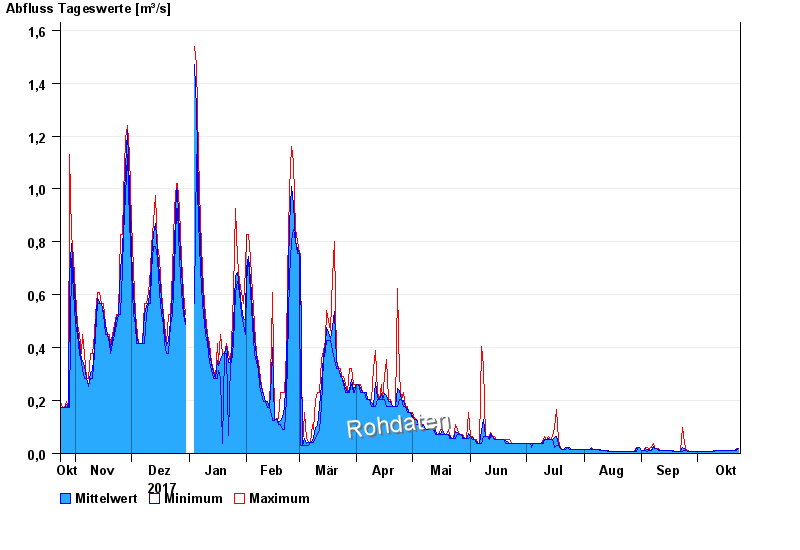
| Date | Mean value [m³/s] | Maximum [m³/s] | Minimum [m³/s] |
|---|---|---|---|
| 23.10.2018 | 0.018 | 0.018 | 0.018 |
| 22.10.2018 | 0.015 | 0.018 | 0.013 |
| 21.10.2018 | 0.013 | 0.013 | 0.013 |
| 20.10.2018 | 0.013 | 0.013 | 0.013 |
| 19.10.2018 | 0.013 | 0.013 | 0.013 |
| 18.10.2018 | 0.013 | 0.013 | 0.013 |
| 17.10.2018 | 0.013 | 0.013 | 0.013 |
© Bayerisches Landesamt für Umwelt 2024