
- Start >
- Rivers >
- Discharge >
- Oberer Main - Elbe >
- Lohr >
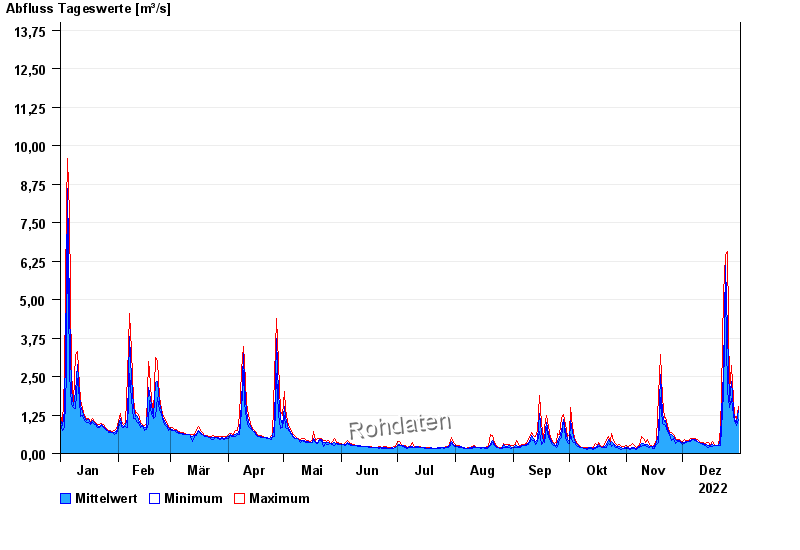
- Chart of year

Chart of year Lohr / Baunach
Discharge from 01.01.2022 to 31.12.2022
- 07.05.1969 Abfluss: 44 m³/s
- 24.12.1967 Abfluss: 35 m³/s
- 06.12.1965 Abfluss: 34,8 m³/s
- 15.01.1968 Abfluss: 29,6 m³/s
- 11.12.1966 Abfluss: 28,8 m³/s
| Date | Mean value [m³/s] | Maximum [m³/s] | Minimum [m³/s] |
|---|---|---|---|
| 31.12.2022 | 1.4 | 1.54 | 1.12 |
| 30.12.2022 | 0.994 | 1.09 | 0.914 |
| 29.12.2022 | 1.12 | 1.24 | 1.03 |
| 28.12.2022 | 1.45 | 1.78 | 1.24 |
| 27.12.2022 | 2.35 | 2.87 | 1.78 |
| 26.12.2022 | 1.7 | 2.04 | 1.51 |
| 25.12.2022 | 3.97 | 6.57 | 2.04 |
© Bayerisches Landesamt für Umwelt 2025