
- Start >
- Rivers >
- Discharge >
- Oberer Main - Elbe >
- Muggendorf >
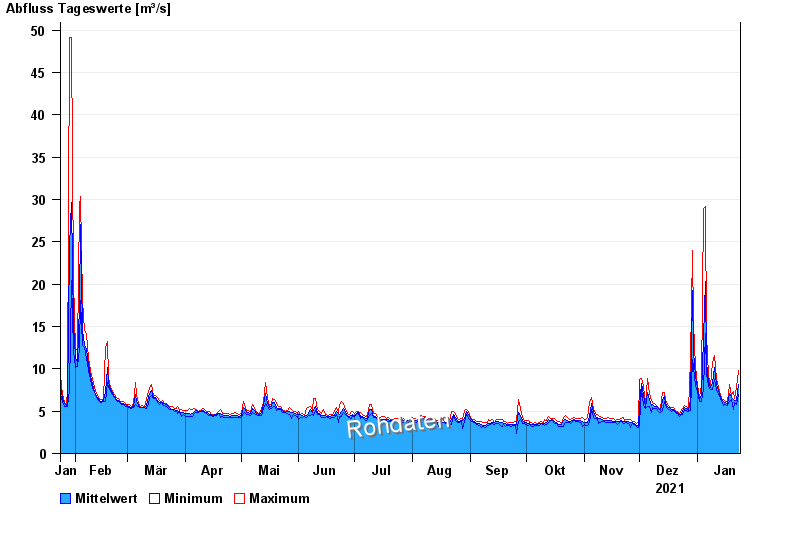
- Chart of year

Chart of year Muggendorf / Wiesent
Discharge from 24.01.2021 to 23.01.2022
| Date | Mean value [m³/s] | Maximum [m³/s] | Minimum [m³/s] |
|---|---|---|---|
| 23.01.2022 | 8.18 | 9.79 | 7.01 |
| 22.01.2022 | 6.21 | 7.75 | 5.82 |
| 21.01.2022 | 6.21 | 6.48 | 5.98 |
| 20.01.2022 | 6.4 | 7.38 | 5.2 |
| 19.01.2022 | 6.66 | 6.83 | 6.32 |
| 18.01.2022 | 7.13 | 8.15 | 6.15 |
| 17.01.2022 | 5.85 | 6.15 | 5.67 |
© Bayerisches Landesamt für Umwelt 2024