
- Start >
- Rivers >
- Discharge >
- Oberer Main - Elbe >
- Oberhammer >
- Chart of year

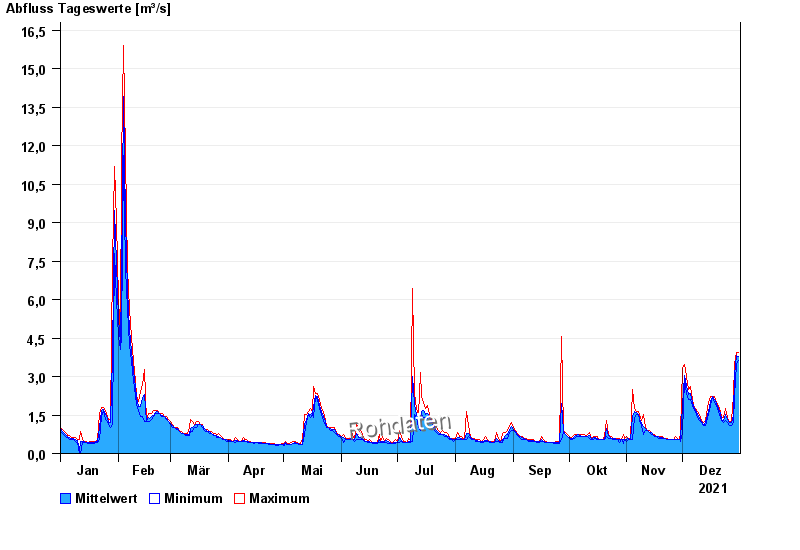
Chart of year Oberhammer / Untere Steinach
Discharge from 01.01.2021 to 31.12.2021
| Date | Mean value [m³/s] | Maximum [m³/s] | Minimum [m³/s] |
|---|---|---|---|
| 31.12.2021 | 3.77 | 3.93 | 3.61 |
| 30.12.2021 | 3.82 | 3.93 | 3.47 |
| 29.12.2021 | 3.05 | 3.47 | 2.23 |
| 28.12.2021 | 1.5 | 2.23 | 1.19 |
| 27.12.2021 | 1.2 | 1.3 | 1.09 |
| 26.12.2021 | 1.19 | 1.19 | 1.09 |
| 25.12.2021 | 1.33 | 1.4 | 1.19 |
© Bayerisches Landesamt für Umwelt 2025