
- Start >
- Rivers >
- Discharge >
- Oberer Main - Elbe >
- Pfarrweisach >
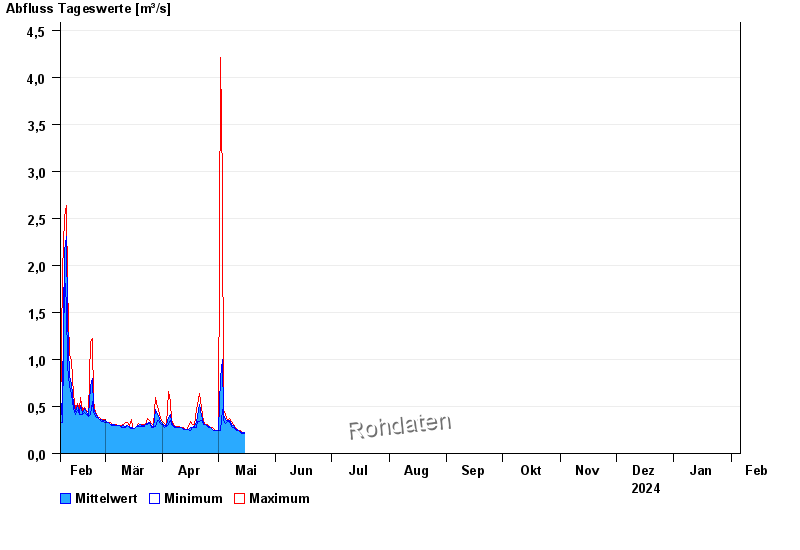
- Chart of year

Chart of year Pfarrweisach / Weisach
Discharge from 06.02.2024 to 05.02.2025
| Date | Mean value [m³/s] | Maximum [m³/s] | Minimum [m³/s] |
|---|---|---|---|
| 11.01.2025 | 0.524 | 0.594 | 0.468 |
| 10.01.2025 | 1.45 | 2.83 | 0.594 |
| 09.01.2025 | 1.58 | 2.9 | 0.392 |
| 08.01.2025 | 0.403 | 0.468 | 0.374 |
| 07.01.2025 | 0.751 | 1.04 | 0.468 |
| 06.01.2025 | 0.936 | 1.04 | 0.638 |
| 05.01.2025 | 0.307 | 0.616 | 0.258 |
© Bayerisches Landesamt für Umwelt 2025