
- Start >
- Rivers >
- Discharge >
- Oberer Main - Elbe >
- Rieblich >
- Chart of year

Chart of year Rieblich / Rodach
Discharge from 26.08.2018 to 25.08.2019
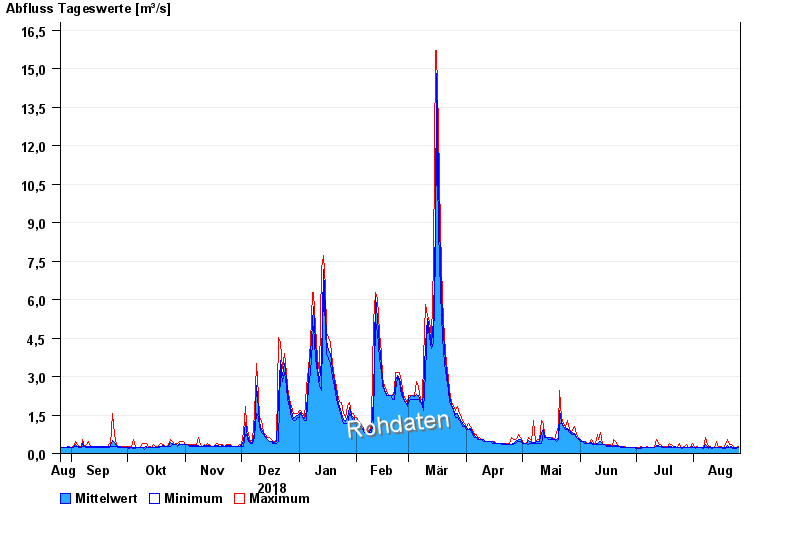
Date | Mean value [m³/s] | Maximum [m³/s] | Minimum [m³/s] |
|---|---|---|---|
| 25.08.2019 | 0.215 | 0.225 | 0.188 |
| 24.08.2019 | 0.196 | 0.225 | 0.187 |
| 23.08.2019 | 0.211 | 0.224 | 0.187 |
| 22.08.2019 | 0.209 | 0.265 | 0.186 |
| 21.08.2019 | 0.244 | 0.311 | 0.223 |
| 20.08.2019 | 0.211 | 0.264 | 0.185 |
| 19.08.2019 | 0.263 | 0.418 | 0.185 |
© Bayerisches Landesamt für Umwelt 2025