
- Start >
- Rivers >
- Discharge >
- Oberer Main - Elbe >
- Unterbruck >
- Chart of year

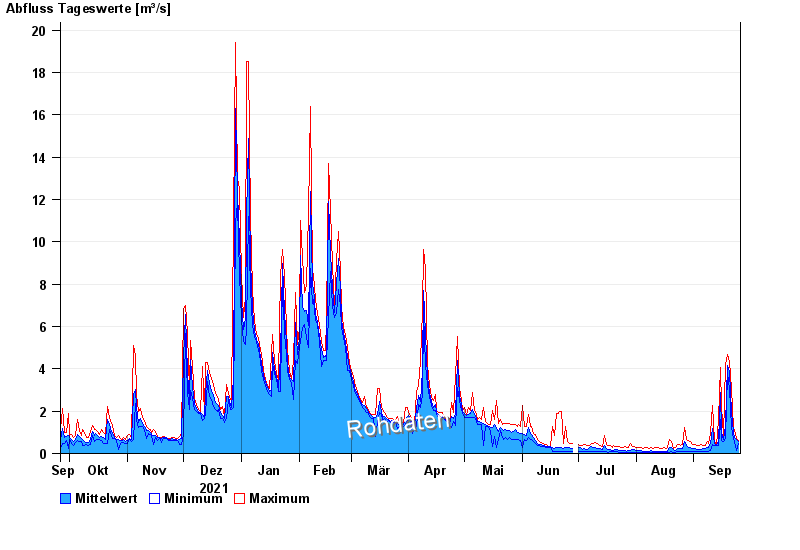
Chart of year Unterbruck / Haidenaab
Discharge from 26.09.2021 to 25.09.2022
| Date | Mean value [m³/s] | Maximum [m³/s] | Minimum [m³/s] |
|---|---|---|---|
| 25.09.2022 | 0.574 | 0.616 | 0.47 |
| 24.09.2022 | 0.647 | 0.732 | 0.15 |
| 23.09.2022 | 0.742 | 1.08 | 0.564 |
| 22.09.2022 | 1 | 1.25 | 0.732 |
| 21.09.2022 | 1.93 | 3.05 | 1.25 |
| 20.09.2022 | 3.87 | 4.37 | 3.05 |
| 19.09.2022 | 4.17 | 4.67 | 3.77 |
© Bayerisches Landesamt für Umwelt 2024