
- Start >
- Rivers >
- Discharge >
- Oberer Main - Elbe >
- Unterbruck Flutmulde >
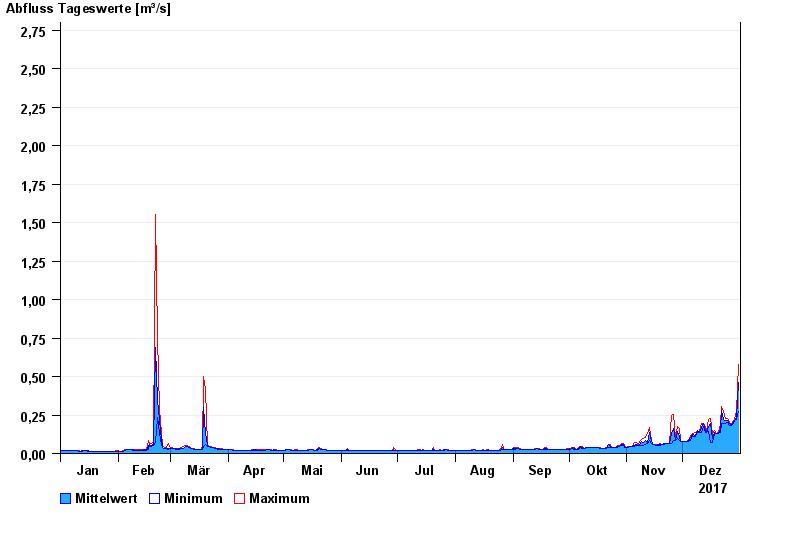
- Chart of year

Chart of year Unterbruck Flutmulde / Haidenaab
Discharge from 01.01.2017 to 31.12.2017
- 26.01.1995 Abfluss: 31,3 m³/s
- 14.01.2011 Abfluss: 27 m³/s
- 13.02.2005 Abfluss: 25,9 m³/s
- 31.03.2006 Abfluss: 22,8 m³/s
- 24.12.2012 Abfluss: 22,6 m³/s
| Date | Mean value [m³/s] | Maximum [m³/s] | Minimum [m³/s] |
|---|---|---|---|
| 31.12.2017 | 0.46 | 0.581 | 0.271 |
| 30.12.2017 | 0.233 | 0.271 | 0.218 |
| 29.12.2017 | 0.216 | 0.218 | 0.214 |
| 28.12.2017 | 0.202 | 0.214 | 0.193 |
| 27.12.2017 | 0.19 | 0.193 | 0.182 |
| 26.12.2017 | 0.197 | 0.204 | 0.181 |
| 25.12.2017 | 0.216 | 0.229 | 0.202 |
© Bayerisches Landesamt für Umwelt 2025