
- Start >
- Rivers >
- Discharge >
- Oberer Main - Elbe >
- Wasserburg >
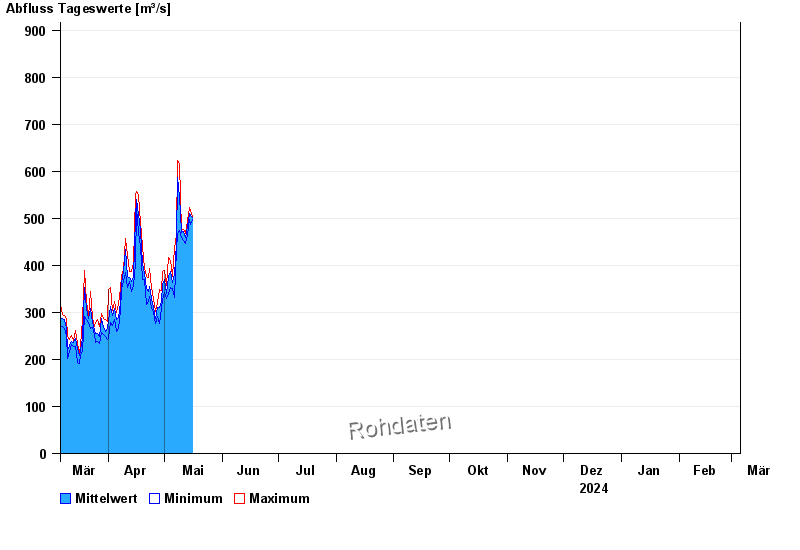
- Chart of year

Chart of year Wasserburg / Inn
Discharge from 06.03.2024 to 05.03.2025
- 23.08.2005 Abfluss: 2940 m³/s
- 07.08.1985 Abfluss: 2660 m³/s
- 29.07.1840 Abfluss: 2630 m³/s
- 14.09.1899 Abfluss: 2590 m³/s
- 04.08.1851 Abfluss: 2550 m³/s
| Date | Mean value [m³/s] | Maximum [m³/s] | Minimum [m³/s] |
|---|---|---|---|
| 17.07.2024 | 718 | 746 | 690 |
| 16.07.2024 | 767 | 818 | 705 |
| 15.07.2024 | 814 | 875 | 762 |
| 14.07.2024 | 952 | 1080 | 822 |
| 13.07.2024 | 1230 | 1410 | 1070 |
| 12.07.2024 | 980 | 1090 | 855 |
| 11.07.2024 | 880 | 951 | 814 |
© Bayerisches Landesamt für Umwelt 2024