
- Start >
- Rivers >
- Discharge >
- Iller - Lech - Bodensee >
- Brunnen >
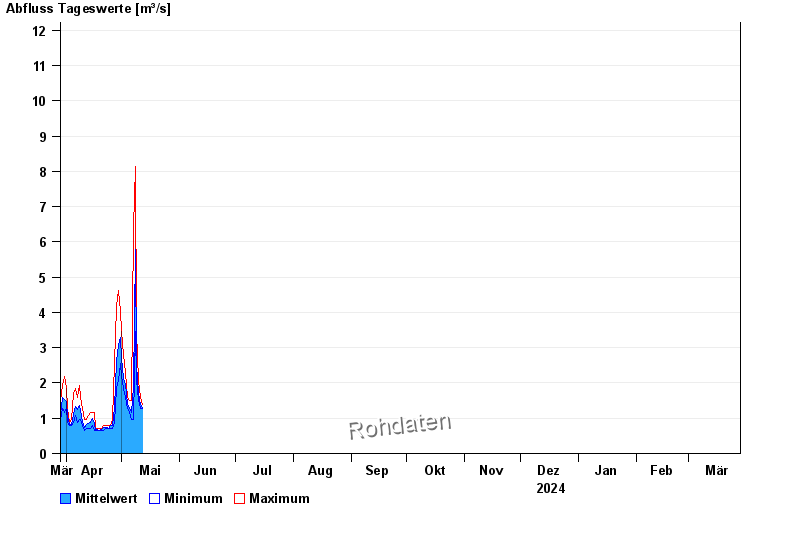
- Chart of year

Chart of year Brunnen / Mühlberger Ach
Discharge from 29.03.2024 to 28.03.2025
- 03.06.2010 Abfluss: 50,8 m³/s
- 02.06.2013 Abfluss: 49,8 m³/s
- 23.08.2005 Abfluss: 47,6 m³/s
- 23.07.1966 Abfluss: 40,1 m³/s
- 10.08.1970 Abfluss: 40 m³/s
| Date | Mean value [m³/s] | Maximum [m³/s] | Minimum [m³/s] |
|---|---|---|---|
| 18.09.2024 | 5.75 | 7.06 | 4.92 |
| 17.09.2024 | 9.46 | 12.1 | 7.22 |
| 16.09.2024 | 5.05 | 7.06 | 4.2 |
| 15.09.2024 | 4.7 | 5.52 | 4.35 |
| 14.09.2024 | 6.73 | 7.38 | 5.52 |
| 13.09.2024 | 3 | 5.22 | 1.39 |
| 12.09.2024 | 1.53 | 1.72 | 1.28 |
© Bayerisches Landesamt für Umwelt 2024