
- Start >
- Rivers >
- Discharge >
- Iller - Lech - Bodensee >
- Durach >
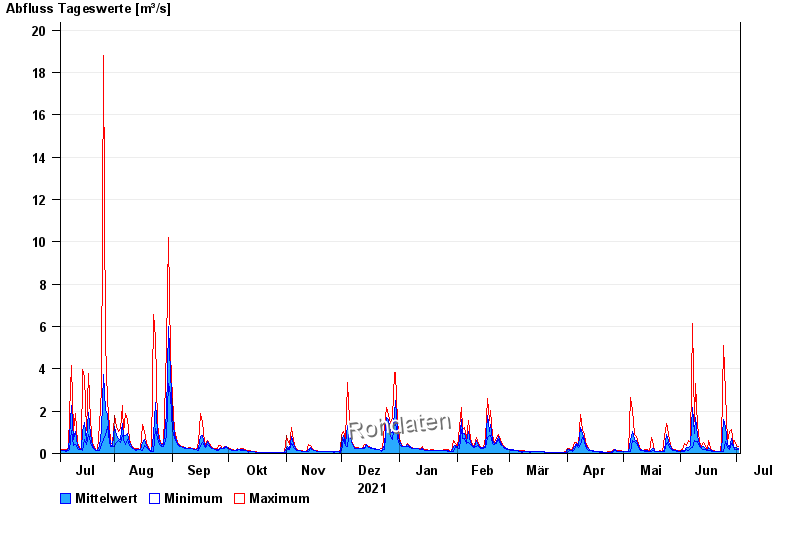
- Chart of year

Chart of year Durach / Durach
Discharge from 03.07.2021 to 02.07.2022
| Date | Mean value [m³/s] | Maximum [m³/s] | Minimum [m³/s] |
|---|---|---|---|
| 02.07.2022 | 0.247 | 0.313 | 0.177 |
| 01.07.2022 | 0.272 | 0.355 | 0.177 |
| 30.06.2022 | 0.243 | 0.617 | 0.206 |
| 29.06.2022 | 0.355 | 0.449 | 0.274 |
| 28.06.2022 | 0.718 | 1.14 | 0.449 |
| 27.06.2022 | 0.301 | 1.05 | 0.206 |
| 26.06.2022 | 0.411 | 0.558 | 0.274 |
© Bayerisches Landesamt für Umwelt 2024