
- Start >
- Rivers >
- Discharge >
- Iller - Lech - Bodensee >
- Fallmühle >
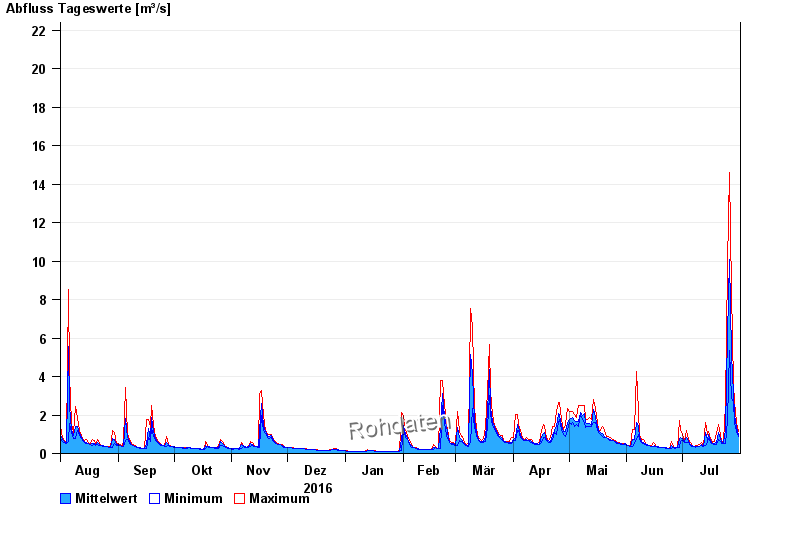
- Chart of year

Chart of year Fallmühle / Steinacher Achen
Discharge from 01.08.2016 to 31.07.2017
 Für diesen Pegel sind keine historische Ereignisse hinterlegt.
| Date | Mean value [m³/s] | Maximum [m³/s] | Minimum [m³/s] |
|---|---|---|---|
| 31.07.2017 | 1.1 | 1.25 | 1.02 |
| 30.07.2017 | 1.4 | 1.62 | 1.25 |
| 29.07.2017 | 1.99 | 2.56 | 1.62 |
| 28.07.2017 | 2.98 | 3.5 | 2.56 |
| 27.07.2017 | 5.16 | 8.58 | 2.72 |
| 26.07.2017 | 10.2 | 14.8 | 5.32 |
| 25.07.2017 | 6.21 | 10 | 1.73 |
© Bayerisches Landesamt für Umwelt 2024