
- Start >
- Rivers >
- Discharge >
- Iller - Lech - Bodensee >
- Gschwend >
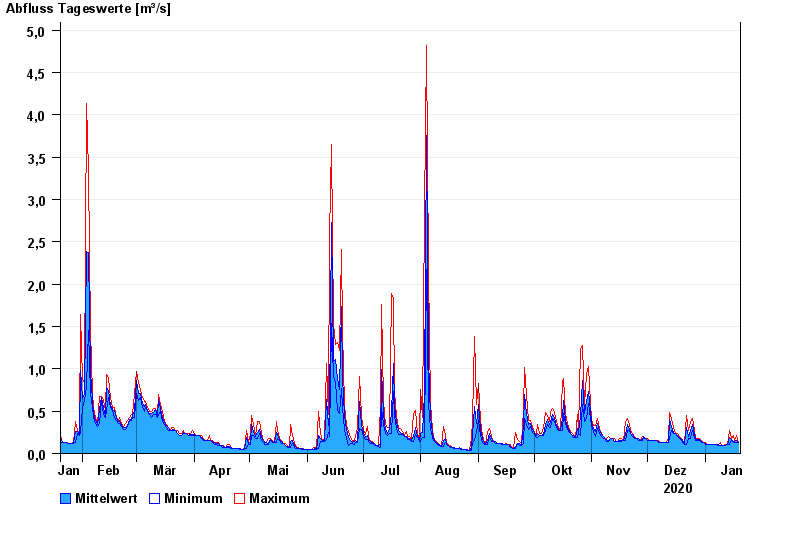
- Chart of year

Chart of year Gschwend / Rottach
Discharge from 20.01.2020 to 19.01.2021
| Date | Mean value [m³/s] | Maximum [m³/s] | Minimum [m³/s] |
|---|---|---|---|
| 19.01.2021 | 0.131 | 0.131 | 0.131 |
| 18.01.2021 | 0.154 | 0.209 | 0.131 |
| 17.01.2021 | 0.146 | 0.154 | 0.131 |
| 16.01.2021 | 0.143 | 0.209 | 0.131 |
| 15.01.2021 | 0.166 | 0.179 | 0.154 |
| 14.01.2021 | 0.189 | 0.274 | 0.111 |
| 13.01.2021 | 0.111 | 0.111 | 0.111 |
© Bayerisches Landesamt für Umwelt 2024