
- Start >
- Rivers >
- Discharge >
- Iller - Lech - Bodensee >
- Pfronten Ried >
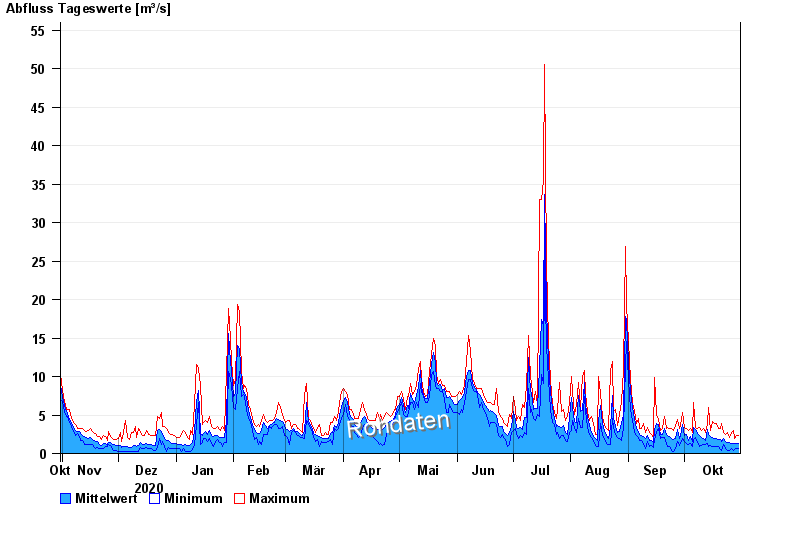
- Chart of year

Chart of year Pfronten Ried / Vils
Discharge from 31.10.2020 to 30.10.2021
| Date | Mean value [m³/s] | Maximum [m³/s] | Minimum [m³/s] |
|---|---|---|---|
| 30.10.2021 | 1.25 | 2.31 | 0.711 |
| 29.10.2021 | 1.29 | 2.31 | 0.641 |
| 28.10.2021 | 1.29 | 1.93 | 0.526 |
| 27.10.2021 | 1.34 | 2.95 | 0.431 |
| 26.10.2021 | 1.36 | 2.73 | 0.711 |
| 25.10.2021 | 1.39 | 2.11 | 0.355 |
| 24.10.2021 | 1.48 | 2.73 | 0.355 |
© Bayerisches Landesamt für Umwelt 2024