
- Start >
- Rivers >
- Discharge >
- Iller - Lech - Bodensee >
- Pfronten Ried >
- Chart of year

Chart of year Pfronten Ried / Vils
Discharge from 26.01.2021 to 25.01.2022
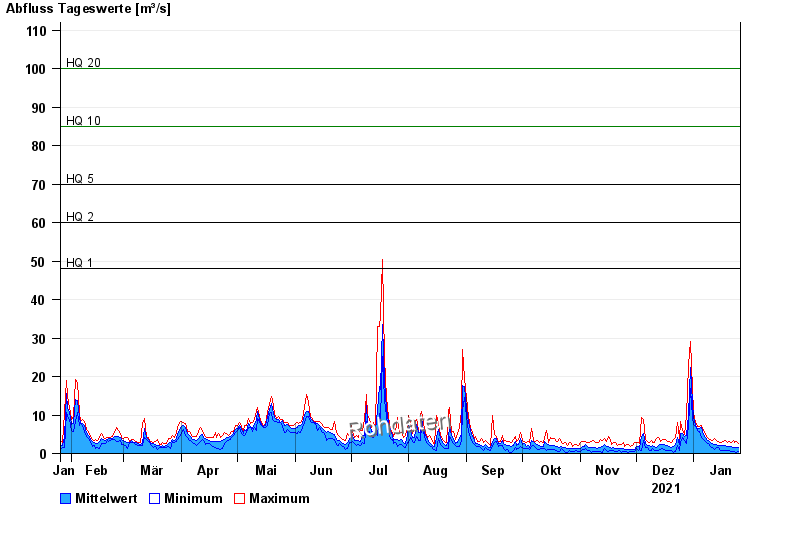
- HQ1 48 m³/s
- HQ2 60 m³/s
- HQ5 70 m³/s
- HQ10 85 m³/s
- HQ20 100 m³/s
- HQ50 120 m³/s
- HQ100 140 m³/s
| Date | Mean value [m³/s] | Maximum [m³/s] | Minimum [m³/s] |
|---|---|---|---|
| 25.01.2022 | 1.53 | 2.51 | 0.391 |
| 24.01.2022 | 1.61 | 3.19 | 0.355 |
| 23.01.2022 | 1.64 | 2.95 | 0.431 |
| 22.01.2022 | 1.67 | 3.42 | 0.526 |
| 21.01.2022 | 1.74 | 2.73 | 0.583 |
| 20.01.2022 | 1.83 | 3.19 | 0.786 |
| 19.01.2022 | 1.87 | 2.95 | 0.786 |
© Bayerisches Landesamt für Umwelt 2024