
- Start >
- Rivers >
- Discharge >
- Iller - Lech - Bodensee >
- Unternogg >
- Chart of year

Chart of year Unternogg / Halbammer
Discharge from 01.01.2024 to 31.12.2024
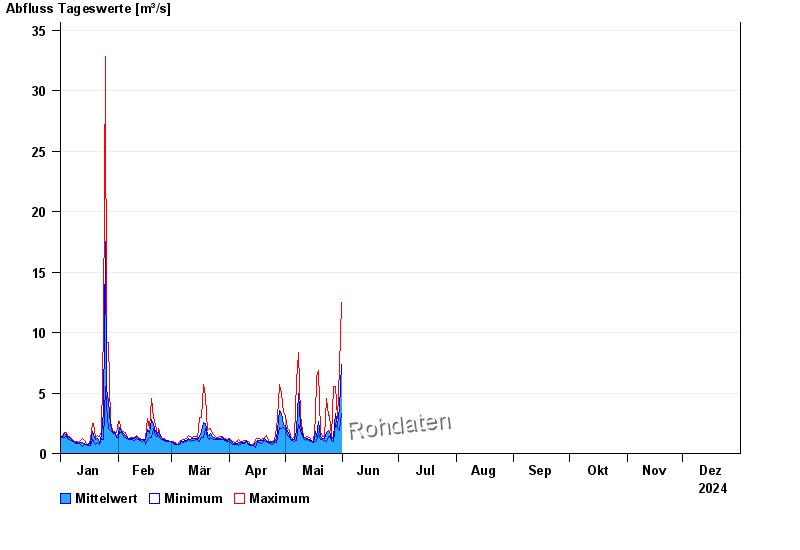
Date | Mean value [m³/s] | Maximum [m³/s] | Minimum [m³/s] |
|---|---|---|---|
| 31.12.2024 | 0.501 | 0.575 | 0.452 |
| 30.12.2024 | 0.66 | 0.724 | 0.577 |
| 29.12.2024 | 0.678 | 0.724 | 0.672 |
| 28.12.2024 | 0.617 | 0.672 | 0.577 |
| 27.12.2024 | 0.599 | 0.622 | 0.577 |
| 26.12.2024 | 0.633 | 0.779 | 0.534 |
| 25.12.2024 | 0.661 | 0.724 | 0.577 |
© Bayerisches Landesamt für Umwelt 2025