

Chart of year Arnstein / Wern
Discharge from 01.01.2023 to 31.12.2023
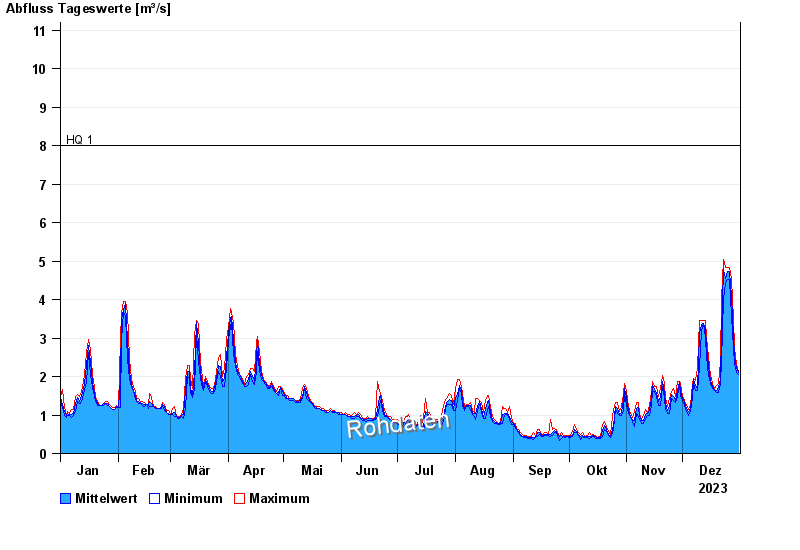
- HQ1 8 m³/s
- HQ2 12 m³/s
- HQ5 18 m³/s
- HQ10 22 m³/s
- HQ20 26 m³/s
- HQ50 32 m³/s
- HQ100 37 m³/s
| Date | Mean value [m³/s] | Maximum [m³/s] | Minimum [m³/s] |
|---|---|---|---|
| 31.12.2023 | 2.1 | 2.11 | 2.04 |
| 30.12.2023 | 2.23 | 2.33 | 2.11 |
| 29.12.2023 | 2.51 | 2.73 | 2.33 |
| 28.12.2023 | 3.03 | 3.5 | 2.73 |
| 27.12.2023 | 4.04 | 4.48 | 3.5 |
| 26.12.2023 | 4.7 | 4.79 | 4.48 |
| 25.12.2023 | 4.68 | 4.79 | 4.48 |
© Bayerisches Landesamt für Umwelt 2024