

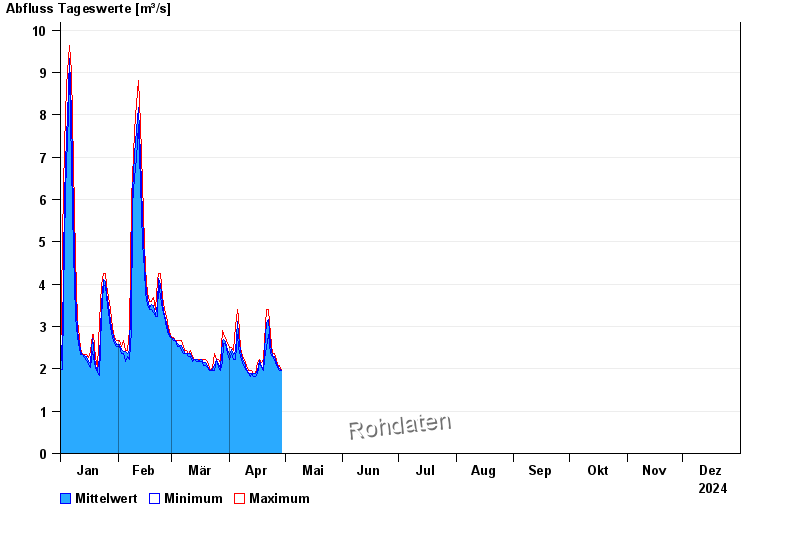
Chart of year Arnstein / Wern
Discharge from 01.01.2024 to 31.12.2024
| Date | Mean value [m³/s] | Maximum [m³/s] | Minimum [m³/s] |
|---|---|---|---|
| 07.10.2024 | 0.865 | 0.865 | 0.865 |
| 06.10.2024 | 0.869 | 0.909 | 0.818 |
| 05.10.2024 | 0.876 | 0.909 | 0.865 |
| 04.10.2024 | 0.951 | 1.01 | 0.909 |
| 03.10.2024 | 1.11 | 1.28 | 1.01 |
| 02.10.2024 | 1.28 | 1.39 | 1.22 |
| 01.10.2024 | 1.15 | 1.28 | 0.909 |
© Bayerisches Landesamt für Umwelt 2024