
- Start >
- Rivers >
- Discharge >
- Inn >
- Eggenfelden >
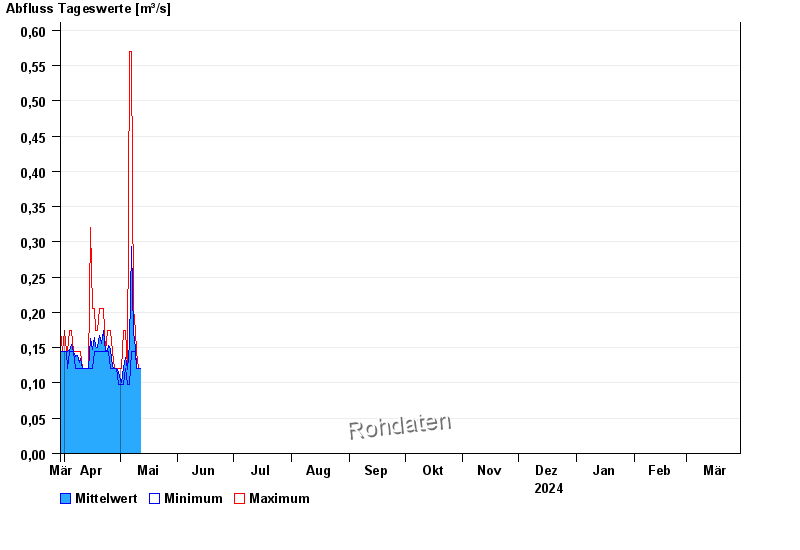
- Chart of year

Chart of year Eggenfelden / Mertseebach
Discharge from 30.03.2024 to 29.03.2025
Bauarbeiten
Zwecks Umbau zur Zeit keine Datenübertragung möglich!
- 02.03.1987 Abfluss: 13,3 m³/s
- 13.01.2011 Abfluss: 12,8 m³/s
- 02.06.2013 Abfluss: 11,5 m³/s
- 02.08.1991 Abfluss: 11,2 m³/s
- 17.07.2010 Abfluss: 9,99 m³/s
| Date | Mean value [m³/s] | Maximum [m³/s] | Minimum [m³/s] |
|---|---|---|---|
| 16.07.2024 | 0.202 | 2 | 0.087 |
| 15.07.2024 | 0.087 | 0.087 | 0.087 |
| 14.07.2024 | 0.109 | 0.13 | 0.087 |
| 13.07.2024 | 0.242 | 0.386 | 0.13 |
| 12.07.2024 | 0.144 | 1.7 | 0.107 |
| 11.07.2024 | 0.105 | 0.107 | 0.087 |
| 10.07.2024 | 0.088 | 0.107 | 0.087 |
© Bayerisches Landesamt für Umwelt 2024