
- Start >
- Rivers >
- Discharge >
- Inn >
- Eschelbach Q >
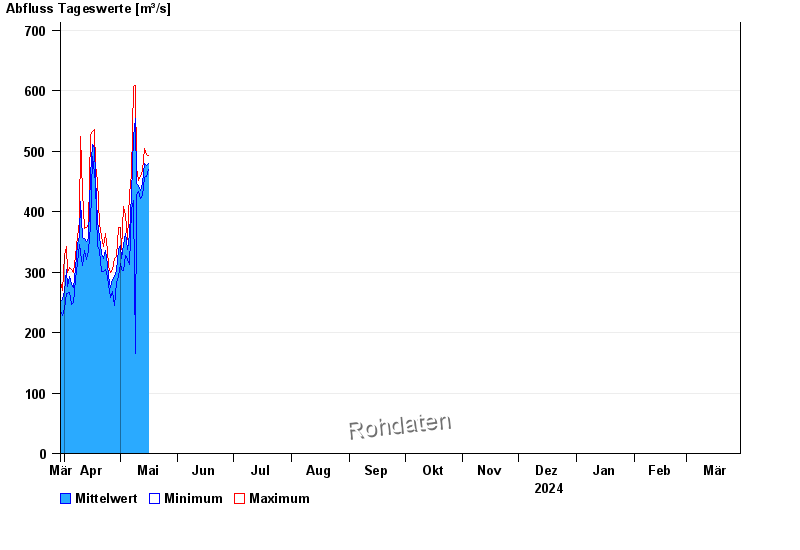
- Chart of year

Chart of year Eschelbach Q / Inn
Discharge from 30.03.2024 to 29.03.2025
 Für diesen Pegel sind keine -Sommer hinterlegt.
| Date | Mean value [m³/s] | Maximum [m³/s] | Minimum [m³/s] |
|---|---|---|---|
| 18.07.2024 | 693 | 728 | 649 |
| 17.07.2024 | 715 | 849 | 557 |
| 16.07.2024 | 788 | 855 | 699 |
| 15.07.2024 | 835 | 924 | 772 |
| 14.07.2024 | 1040 | 1220 | 434 |
| 13.07.2024 | 1310 | 1520 | 1120 |
| 12.07.2024 | 1000 | 1160 | 883 |
© Bayerisches Landesamt für Umwelt 2024