

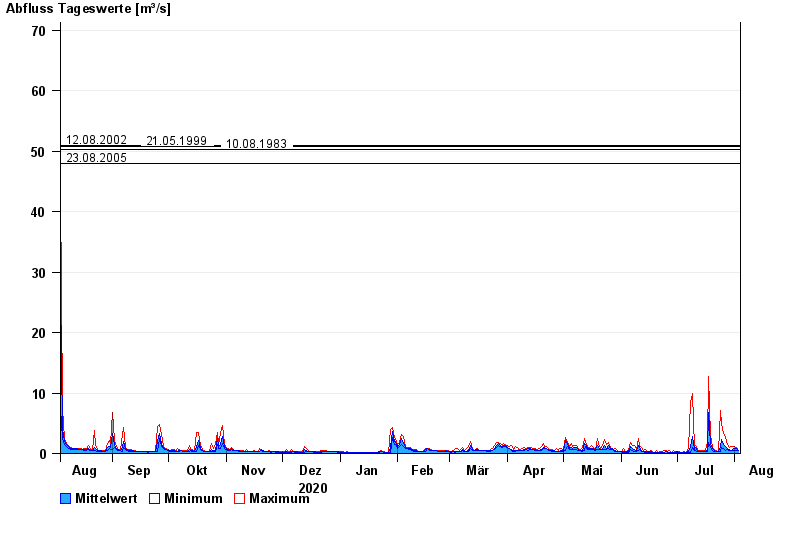
Chart of year Gaißach / Große Gaißach
Discharge from 04.08.2020 to 03.08.2021
- 23.07.1966 Abfluss: 85 m³/s
- 12.08.2002 Abfluss: 51 m³/s
- 21.05.1999 Abfluss: 50,7 m³/s
- 10.08.1983 Abfluss: 50,3 m³/s
- 23.08.2005 Abfluss: 47,9 m³/s
| Date | Mean value [m³/s] | Maximum [m³/s] | Minimum [m³/s] |
|---|---|---|---|
| 03.08.2021 | 0.527 | 0.557 | 0.493 |
| 02.08.2021 | 0.773 | 0.932 | 0.557 |
| 01.08.2021 | 0.772 | 1.2 | 0.557 |
| 31.07.2021 | 0.757 | 1.2 | 0.558 |
| 30.07.2021 | 0.544 | 1.2 | 0.437 |
| 29.07.2021 | 0.691 | 0.935 | 0.558 |
| 28.07.2021 | 0.817 | 1.51 | 0.627 |
© Bayerisches Landesamt für Umwelt 2024