

Chart of year Gaißach / Große Gaißach
Discharge from 07.05.2022 to 06.05.2023
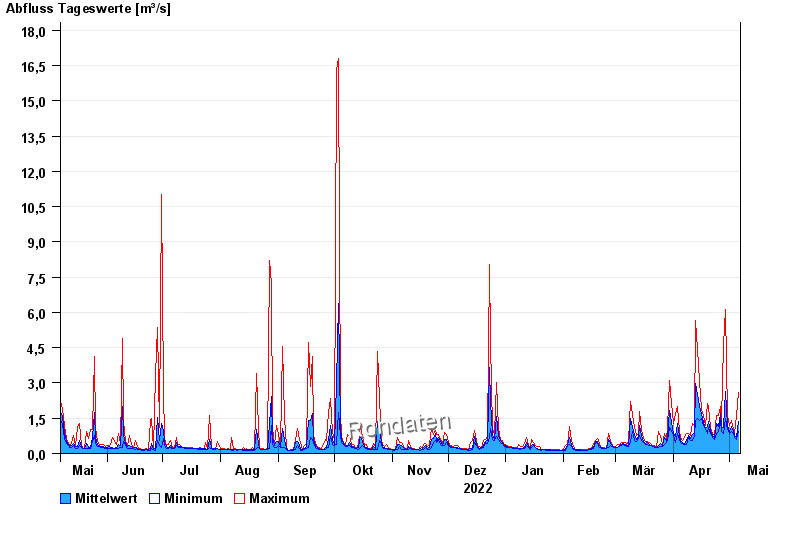
| Date | Mean value [m³/s] | Maximum [m³/s] | Minimum [m³/s] |
|---|---|---|---|
| 06.05.2023 | 1.35 | 2.58 | 0.922 |
| 05.05.2023 | 0.744 | 1.6 | 0.611 |
| 04.05.2023 | 0.771 | 0.839 | 0.681 |
| 03.05.2023 | 0.933 | 1.01 | 0.839 |
| 02.05.2023 | 1.16 | 1.39 | 0.922 |
| 01.05.2023 | 0.952 | 1.19 | 0.839 |
| 30.04.2023 | 1.21 | 1.6 | 1.01 |
© Bayerisches Landesamt für Umwelt 2024