
- Start >
- Rivers >
- Discharge >
- Inn >
- Großschwindau >
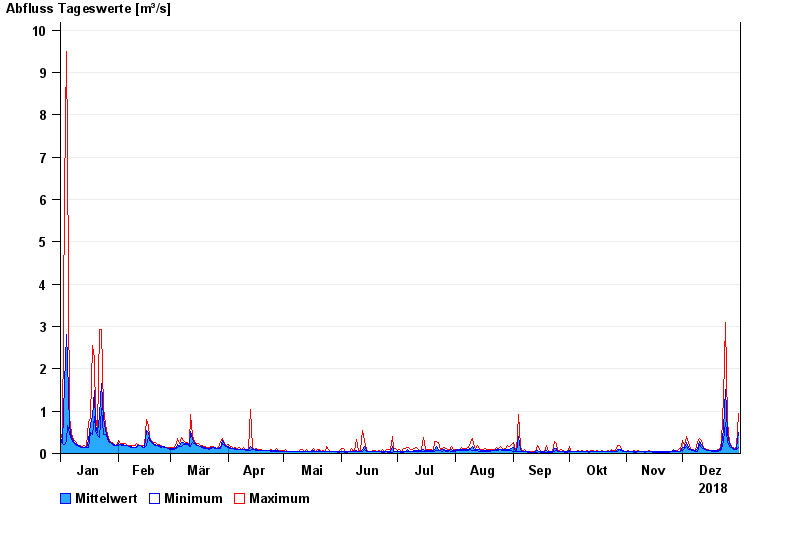
- Chart of year

Chart of year Großschwindau / Goldach
Discharge from 01.01.2018 to 31.12.2018
| Date | Mean value [m³/s] | Maximum [m³/s] | Minimum [m³/s] |
|---|---|---|---|
| 31.12.2018 | 0.495 | 0.936 | 0.131 |
| 30.12.2018 | 0.129 | 0.167 | 0.091 |
| 29.12.2018 | 0.097 | 0.104 | 0.091 |
| 28.12.2018 | 0.122 | 0.13 | 0.103 |
| 27.12.2018 | 0.157 | 0.176 | 0.13 |
| 26.12.2018 | 0.231 | 0.29 | 0.176 |
| 25.12.2018 | 0.463 | 0.742 | 0.29 |
© Bayerisches Landesamt für Umwelt 2025