

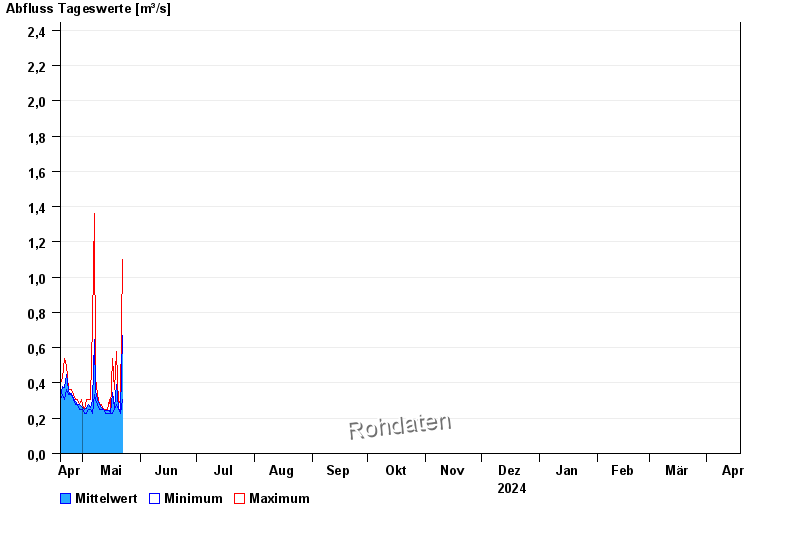
Chart of year Kollbach / Kollbach
Discharge from 19.04.2024 to 18.04.2025
- HQ1 25 m³/s
- HQ2 32 m³/s
- HQ5 35 m³/s
- HQ10 45 m³/s
- HQ20 57 m³/s
- HQ50 72 m³/s
- HQ100 90 m³/s
| Date | Mean value [m³/s] | Maximum [m³/s] | Minimum [m³/s] |
|---|---|---|---|
| 17.07.2024 | 0.276 | 0.297 | 0.245 |
| 16.07.2024 | 0.394 | 0.729 | 0.245 |
| 15.07.2024 | 0.259 | 0.297 | 0.245 |
| 14.07.2024 | 0.341 | 0.419 | 0.27 |
| 13.07.2024 | 0.502 | 0.858 | 0.325 |
| 12.07.2024 | 0.263 | 0.325 | 0.245 |
| 11.07.2024 | 0.259 | 0.27 | 0.245 |
© Bayerisches Landesamt für Umwelt 2024