

Chart of year Mühldorf / Inn
Discharge from 23.02.2019 to 22.02.2020
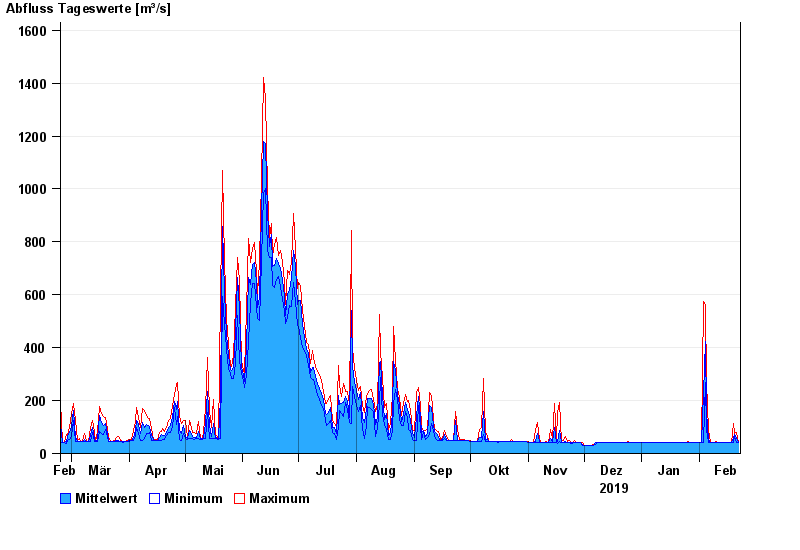
| Date | Mean value [m³/s] | Maximum [m³/s] | Minimum [m³/s] |
|---|---|---|---|
| 22.02.2020 | 40 | 40 | 40 |
| 21.02.2020 | 61.1 | 78.8 | 40 |
| 20.02.2020 | 71.5 | 77.4 | 63.5 |
| 19.02.2020 | 62.1 | 114 | 40.1 |
| 18.02.2020 | 40.1 | 40.2 | 40.1 |
| 17.02.2020 | 40.2 | 41.3 | 40.2 |
| 16.02.2020 | 40.2 | 40.2 | 40.2 |
© Bayerisches Landesamt für Umwelt 2024