

Chart of year Piding / Stoißer Ache
Discharge from 29.03.2021 to 28.03.2022
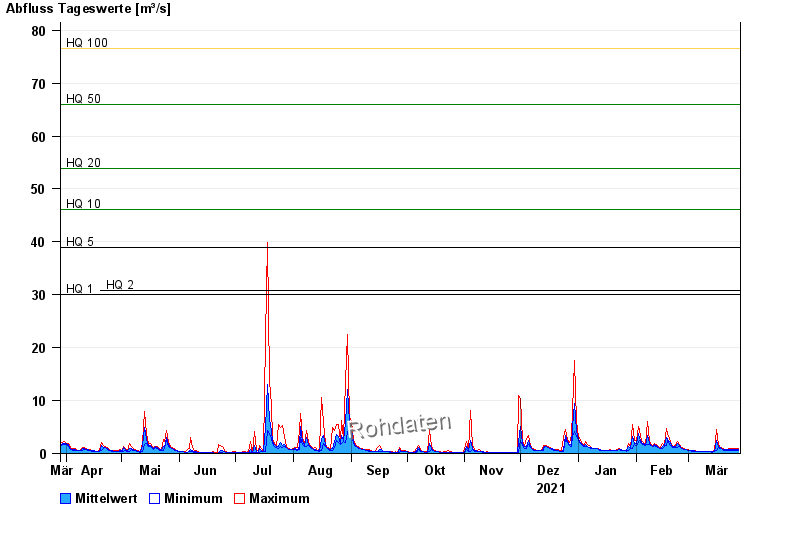
- HQ1 30 m³/s
- HQ2 30,8 m³/s
- HQ5 39 m³/s
- HQ10 46,1 m³/s
- HQ20 53,8 m³/s
- HQ50 66 m³/s
- HQ100 76,5 m³/s
| Date | Mean value [m³/s] | Maximum [m³/s] | Minimum [m³/s] |
|---|---|---|---|
| 28.03.2022 | 0.744 | 0.856 | 0.643 |
| 27.03.2022 | 0.745 | 0.856 | 0.643 |
| 26.03.2022 | 0.777 | 0.856 | 0.643 |
| 25.03.2022 | 0.805 | 0.971 | 0.643 |
| 24.03.2022 | 0.778 | 0.971 | 0.643 |
| 23.03.2022 | 0.702 | 0.856 | 0.643 |
| 22.03.2022 | 0.673 | 0.745 | 0.544 |
© Bayerisches Landesamt für Umwelt 2024