

Chart of year Piding / Stoißer Ache
Discharge from 29.03.2020 to 28.03.2021
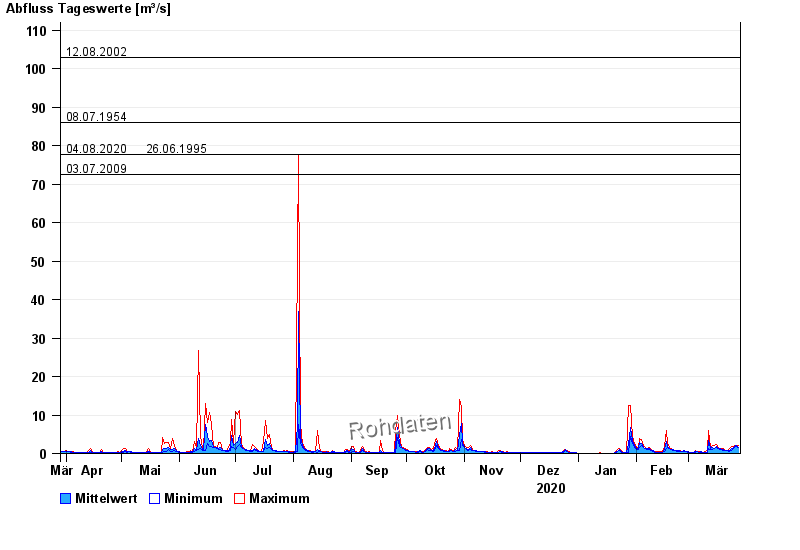
- 12.08.2002 Abfluss: 103 m³/s
- 08.07.1954 Abfluss: 86 m³/s
- 04.08.2020 Abfluss: 77,7 m³/s
- 26.06.1995 Abfluss: 77,6 m³/s
- 03.07.2009 Abfluss: 72,4 m³/s
| Date | Mean value [m³/s] | Maximum [m³/s] | Minimum [m³/s] |
|---|---|---|---|
| 28.03.2021 | 1.64 | 1.96 | 1.48 |
| 27.03.2021 | 1.95 | 2.13 | 1.8 |
| 26.03.2021 | 1.71 | 2.13 | 1.48 |
| 25.03.2021 | 1.4 | 1.8 | 1.18 |
| 24.03.2021 | 1.25 | 1.8 | 0.905 |
| 23.03.2021 | 0.892 | 1.18 | 0.642 |
| 22.03.2021 | 0.811 | 0.905 | 0.774 |
© Bayerisches Landesamt für Umwelt 2024