

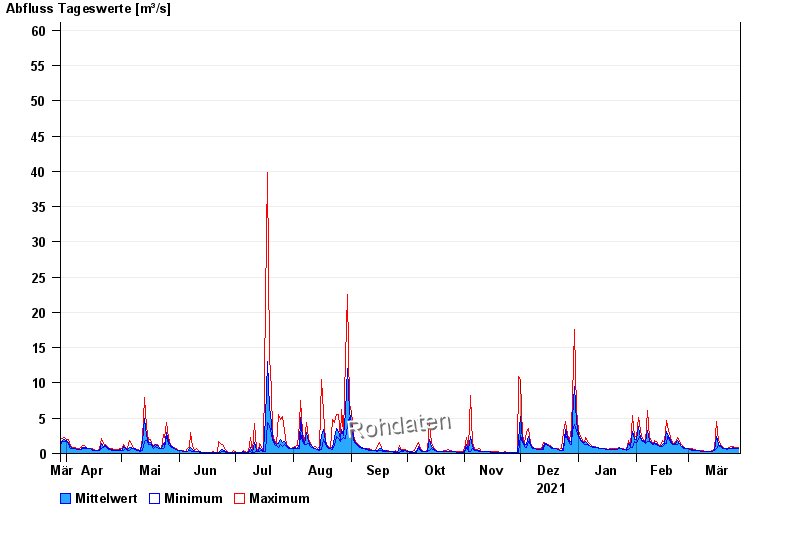
Chart of year Piding / Stoißer Ache
Discharge from 29.03.2021 to 28.03.2022
- 12.08.2002 Abfluss: 103 m³/s
- 08.07.1954 Abfluss: 86 m³/s
- 04.08.2020 Abfluss: 77,7 m³/s
- 26.06.1995 Abfluss: 77,6 m³/s
- 03.07.2009 Abfluss: 72,4 m³/s
| Date | Mean value [m³/s] | Maximum [m³/s] | Minimum [m³/s] |
|---|---|---|---|
| 28.03.2022 | 0.744 | 0.856 | 0.643 |
| 27.03.2022 | 0.745 | 0.856 | 0.643 |
| 26.03.2022 | 0.777 | 0.856 | 0.643 |
| 25.03.2022 | 0.805 | 0.971 | 0.643 |
| 24.03.2022 | 0.778 | 0.971 | 0.643 |
| 23.03.2022 | 0.702 | 0.856 | 0.643 |
| 22.03.2022 | 0.673 | 0.745 | 0.544 |
© Bayerisches Landesamt für Umwelt 2024