

Chart of year Piding / Stoißer Ache
Discharge from 01.01.2024 to 31.12.2024
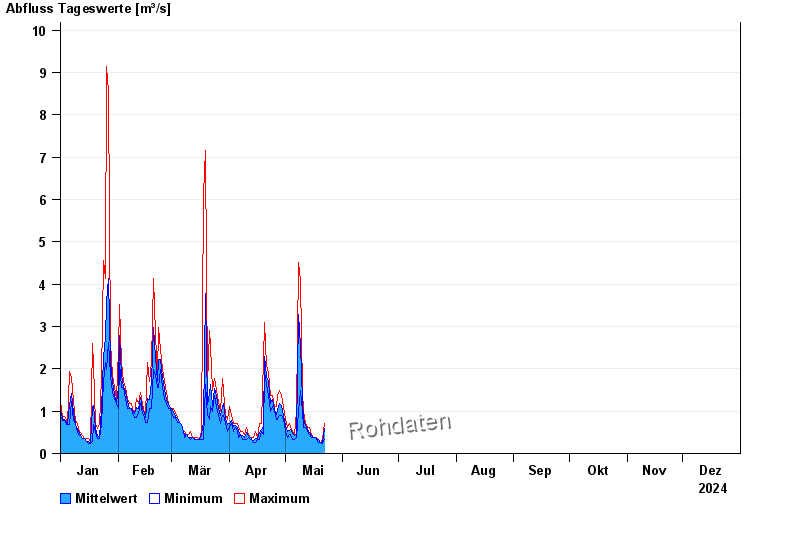
| Date | Mean value [m³/s] | Maximum [m³/s] | Minimum [m³/s] |
|---|---|---|---|
| 31.12.2024 | 0.307 | 0.396 | 0.28 |
| 30.12.2024 | 0.336 | 0.396 | 0.333 |
| 29.12.2024 | 0.394 | 0.465 | 0.333 |
| 28.12.2024 | 0.438 | 0.465 | 0.396 |
| 27.12.2024 | 0.506 | 0.539 | 0.465 |
| 26.12.2024 | 0.609 | 0.713 | 0.539 |
| 25.12.2024 | 0.77 | 0.914 | 0.623 |
© Bayerisches Landesamt für Umwelt 2025