

Chart of year Piding / Stoißer Ache
Discharge from 29.03.2019 to 28.03.2020
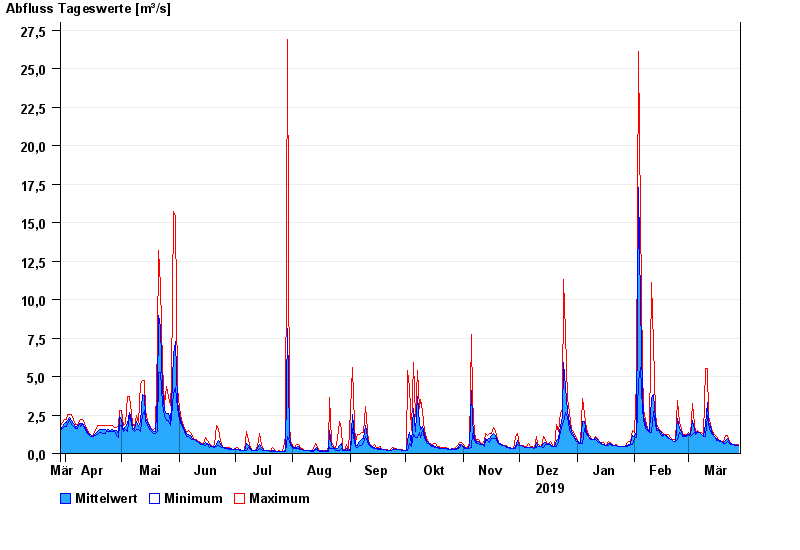
| Date | Mean value [m³/s] | Maximum [m³/s] | Minimum [m³/s] |
|---|---|---|---|
| 28.03.2020 | 0.501 | 0.581 | 0.501 |
| 27.03.2020 | 0.52 | 0.581 | 0.501 |
| 26.03.2020 | 0.562 | 0.582 | 0.502 |
| 25.03.2020 | 0.582 | 0.582 | 0.582 |
| 24.03.2020 | 0.653 | 0.67 | 0.582 |
| 23.03.2020 | 0.722 | 0.765 | 0.67 |
| 22.03.2020 | 0.968 | 1.2 | 0.765 |
© Bayerisches Landesamt für Umwelt 2024