
- Start >
- Rivers >
- Discharge >
- Inn >
- Schneizlreuth Weißbach >
- Chart of year

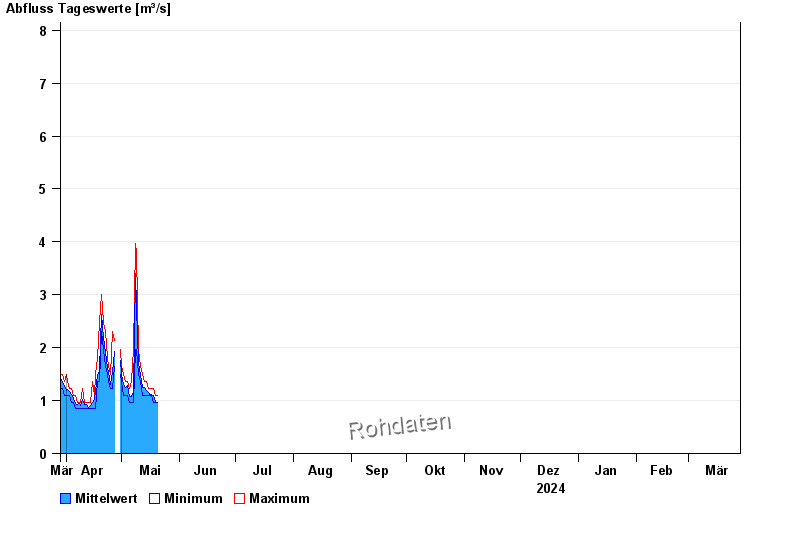
Chart of year Schneizlreuth Weißbach / Weißbach
Discharge from 29.03.2024 to 28.03.2025
- HQ1 17 m³/s
- HQ2 22 m³/s
- HQ5 25 m³/s
- HQ10 33 m³/s
- HQ50 53 m³/s
- HQ100 63 m³/s
| Date | Mean value [m³/s] | Maximum [m³/s] | Minimum [m³/s] |
|---|---|---|---|
| 30.06.2024 | 1.18 | 1.22 | 1.09 |
| 29.06.2024 | 1.18 | 1.36 | 1.09 |
| 28.06.2024 | 1.81 | 3.38 | 1.22 |
| 27.06.2024 | 1.14 | 1.65 | 0.97 |
| 26.06.2024 | 1.07 | 1.09 | 0.97 |
| 25.06.2024 | 1.09 | 1.22 | 0.97 |
| 24.06.2024 | 1.09 | 1.22 | 0.97 |
© Bayerisches Landesamt für Umwelt 2024