
- Start >
- Rivers >
- Discharge >
- Inn >
- Schneizlreuth Weißbach >
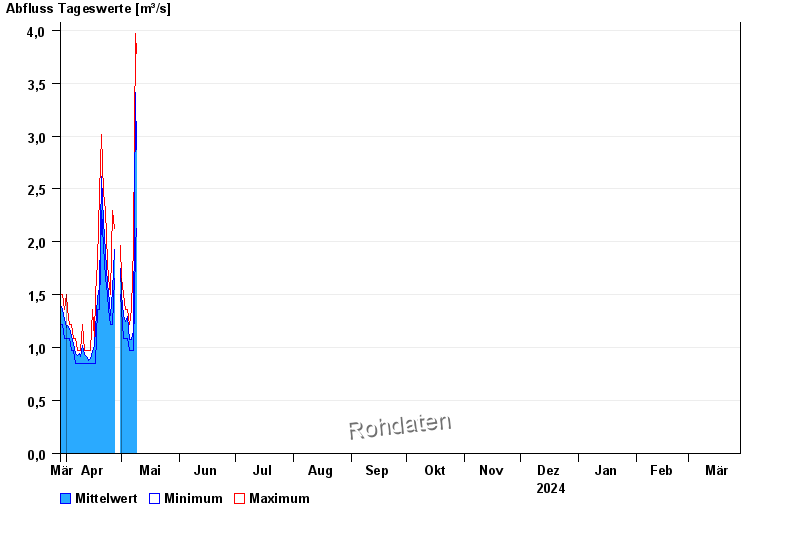
- Chart of year

Chart of year Schneizlreuth Weißbach / Weißbach
Discharge from 29.03.2024 to 28.03.2025
| Date | Mean value [m³/s] | Maximum [m³/s] | Minimum [m³/s] |
|---|---|---|---|
| 16.08.2024 | 0.855 | 0.97 | 0.75 |
| 15.08.2024 | 0.869 | 0.97 | 0.75 |
| 14.08.2024 | 0.984 | 1.09 | 0.854 |
| 13.08.2024 | 0.949 | 1.36 | 0.75 |
| 12.08.2024 | 0.897 | 1.22 | 0.75 |
| 11.08.2024 | 0.872 | 0.97 | 0.854 |
| 10.08.2024 | 0.956 | 1.09 | 0.854 |
© Bayerisches Landesamt für Umwelt 2024