

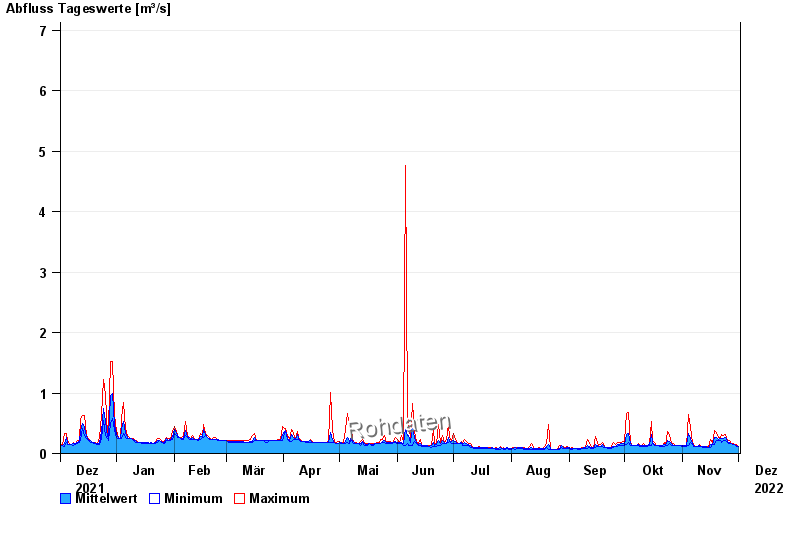
Chart of year Simbach / Simbach
Discharge from 02.12.2021 to 01.12.2022
- 10.07.1999 Abfluss: 50,1 m³/s
- 01.08.1991 Abfluss: 24,7 m³/s
- 10.06.2007 Abfluss: 24,5 m³/s
- 02.03.1987 Abfluss: 24,3 m³/s
- 02.08.1991 Abfluss: 23,8 m³/s
| Date | Mean value [m³/s] | Maximum [m³/s] | Minimum [m³/s] |
|---|---|---|---|
| 01.12.2022 | 0.123 | 0.123 | 0.123 |
| 30.11.2022 | 0.136 | 0.142 | 0.123 |
| 29.11.2022 | 0.142 | 0.142 | 0.142 |
| 28.11.2022 | 0.144 | 0.162 | 0.142 |
| 27.11.2022 | 0.162 | 0.162 | 0.162 |
| 26.11.2022 | 0.184 | 0.208 | 0.162 |
| 25.11.2022 | 0.194 | 0.208 | 0.185 |
© Bayerisches Landesamt für Umwelt 2024