

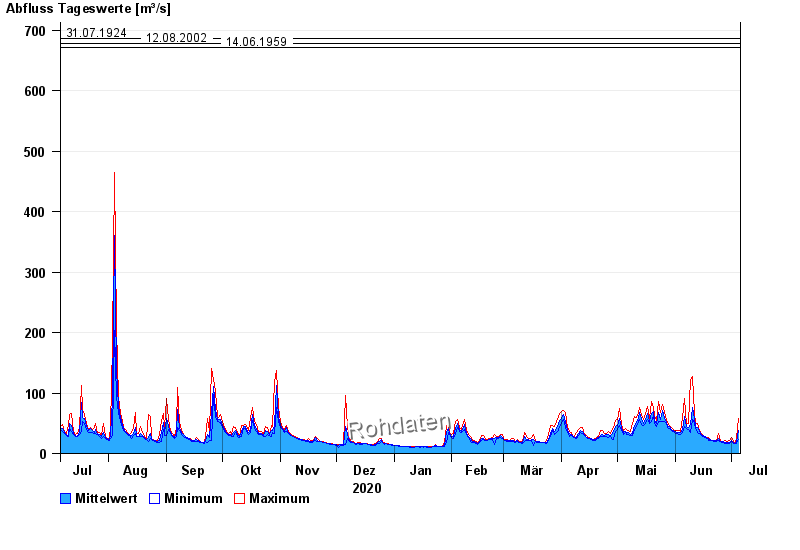
Chart of year Staudach / Tiroler Achen
Discharge from 06.07.2020 to 05.07.2021
- 02.06.2013 Abfluss: 966 m³/s
- 31.05.1940 Abfluss: 780 m³/s
- 31.07.1924 Abfluss: 687 m³/s
- 12.08.2002 Abfluss: 678 m³/s
- 14.06.1959 Abfluss: 671 m³/s
| Date | Mean value [m³/s] | Maximum [m³/s] | Minimum [m³/s] |
|---|---|---|---|
| 05.07.2021 | 37.4 | 57.4 | 23.4 |
| 04.07.2021 | 18.2 | 24.7 | 15.9 |
| 03.07.2021 | 16.5 | 16.9 | 15.9 |
| 02.07.2021 | 18.6 | 21 | 16.9 |
| 01.07.2021 | 21.7 | 26 | 19.8 |
| 30.06.2021 | 17.6 | 22.1 | 16.9 |
| 29.06.2021 | 17.6 | 19.2 | 16.4 |
© Bayerisches Landesamt für Umwelt 2024