

Chart of year Übersee / Überseer Bach
Discharge from 01.01.2024 to 31.12.2024
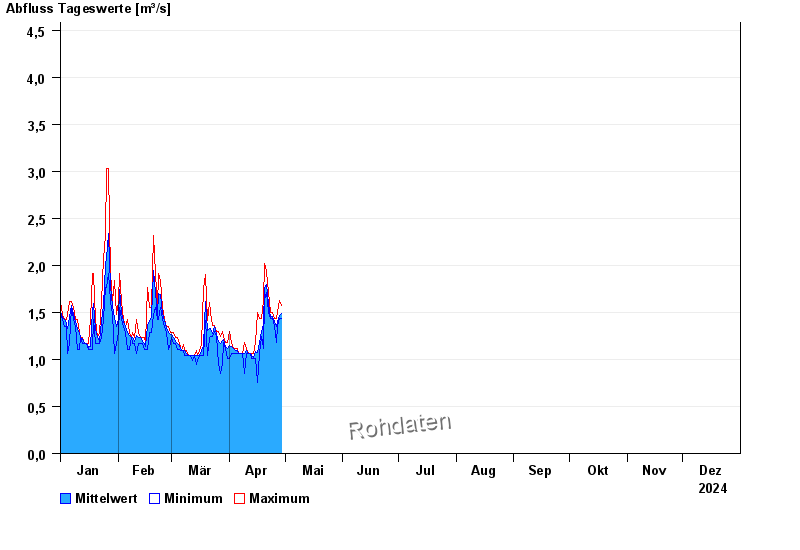
note
Datenabruf nur 07:00, 15:00 und 23:00 MEZ.
Bei Hochwasser kontinuierlich.
- 04.08.2020 Abfluss: 21,6 m³/s
- 02.06.2013 Abfluss: 20,4 m³/s
- 12.08.2002 Abfluss: 12,9 m³/s
- 03.09.2017 Abfluss: 12 m³/s
- 09.05.2007 Abfluss: 10,9 m³/s
| Date | Mean value [m³/s] | Maximum [m³/s] | Minimum [m³/s] |
|---|---|---|---|
| 21.12.2024 | 1.11 | 1.11 | 1.11 |
| 20.12.2024 | 1.19 | 1.24 | 1.11 |
| 19.12.2024 | 1.04 | 1.18 | 0.994 |
| 18.12.2024 | 1.02 | 1.05 | 0.994 |
| 17.12.2024 | 1.03 | 1.05 | 0.994 |
| 16.12.2024 | 0.991 | 1.05 | 0.935 |
| 15.12.2024 | 0.981 | 0.994 | 0.935 |
© Bayerisches Landesamt für Umwelt 2024