

Chart of year Valley / Mangfall
Discharge from 19.04.2024 to 18.04.2025
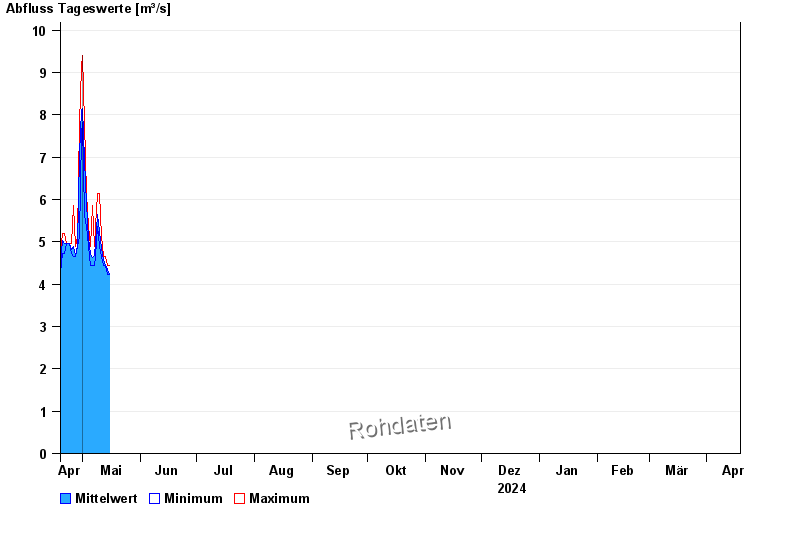
| Date | Mean value [m³/s] | Maximum [m³/s] | Minimum [m³/s] |
|---|---|---|---|
| 08.08.2024 | 4.79 | 4.9 | 4.67 |
| 07.08.2024 | 4.88 | 5.38 | 4.67 |
| 06.08.2024 | 4.89 | 4.9 | 4.67 |
| 05.08.2024 | 5.14 | 5.38 | 4.9 |
| 04.08.2024 | 6.03 | 7.59 | 5.38 |
| 03.08.2024 | 6.2 | 8.8 | 4.44 |
| 02.08.2024 | 4.85 | 6.16 | 4.01 |
© Bayerisches Landesamt für Umwelt 2024