

Chart of year Valley / Mangfall
Discharge from 30.03.2024 to 29.03.2025
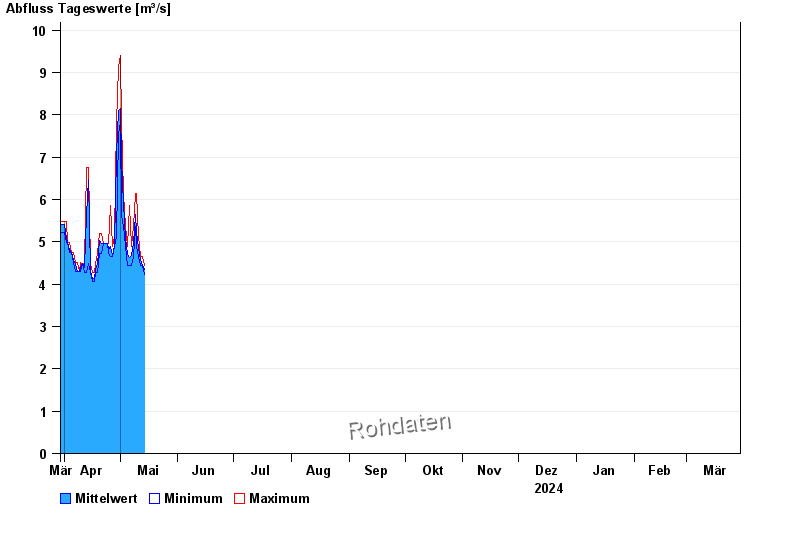
| Date | Mean value [m³/s] | Maximum [m³/s] | Minimum [m³/s] |
|---|---|---|---|
| 17.07.2024 | 3.91 | 4.01 | 3.8 |
| 16.07.2024 | 3.88 | 4.22 | 3.8 |
| 15.07.2024 | 4.03 | 4.22 | 3.8 |
| 14.07.2024 | 4.46 | 4.9 | 4.22 |
| 13.07.2024 | 5.5 | 7 | 4.9 |
| 12.07.2024 | 4.53 | 7.29 | 4.01 |
| 11.07.2024 | 4.63 | 5.38 | 4.22 |
© Bayerisches Landesamt für Umwelt 2024