

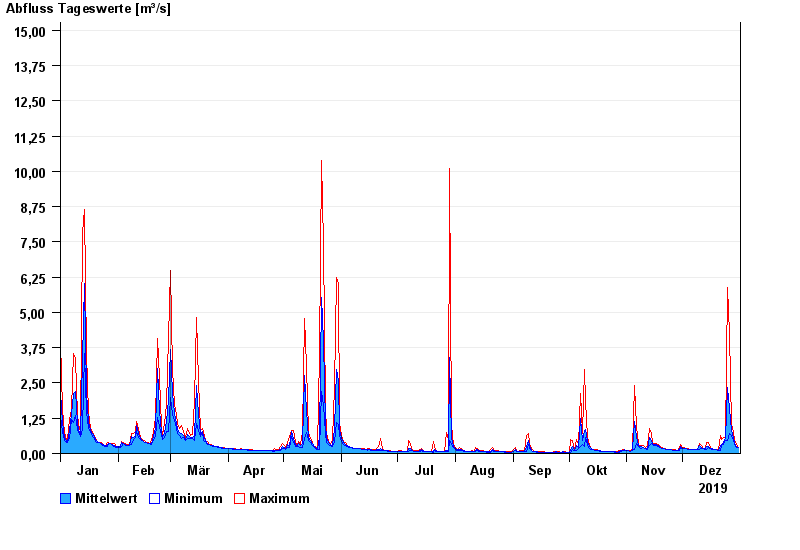
Chart of year Waging / Höllenbach
Discharge from 01.01.2019 to 31.12.2019
note
Datenabruf nur 07:00, 15:00 und 23:00 MEZ.
Bei Hochwasser kontinuierlich.
- 18.11.1964 Abfluss: 37,9 m³/s
- 31.05.1995 Abfluss: 36,8 m³/s
- 10.06.1965 Abfluss: 36,3 m³/s
- 26.06.1995 Abfluss: 35,5 m³/s
- 07.07.1983 Abfluss: 30,8 m³/s
| Date | Mean value [m³/s] | Maximum [m³/s] | Minimum [m³/s] |
|---|---|---|---|
| 31.12.2019 | 0.23 | 0.23 | 0.23 |
| 30.12.2019 | 0.255 | 0.305 | 0.23 |
| 29.12.2019 | 0.356 | 0.446 | 0.305 |
| 28.12.2019 | 0.561 | 0.772 | 0.446 |
| 27.12.2019 | 0.817 | 1.04 | 0.63 |
| 26.12.2019 | 1.6 | 4.24 | 0.701 |
| 25.12.2019 | 2.33 | 5.89 | 0.447 |
© Bayerisches Landesamt für Umwelt 2025