

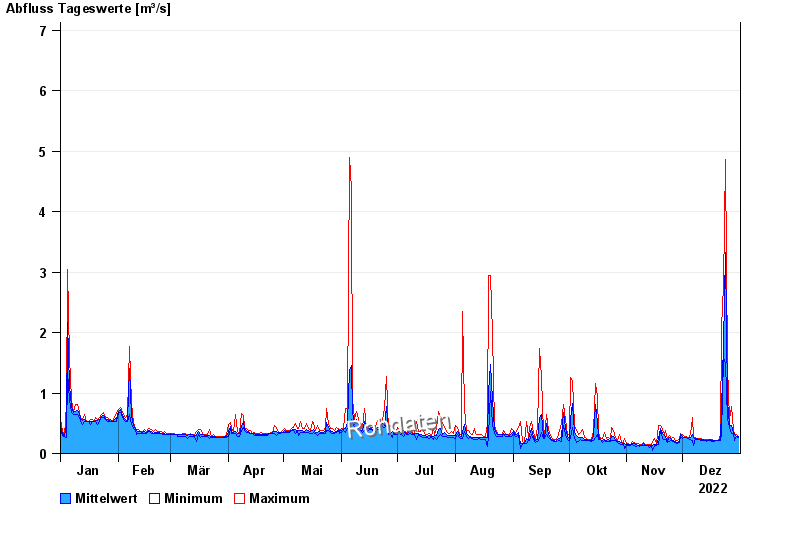
Chart of year Altdorf / Pfettrach
Discharge from 01.01.2022 to 31.12.2022
note
Wasserstand von 08.-12.06.2024, 10:45h, wegen technischen Problemen unplausibel.
- 15.02.1990 Abfluss: 52,3 m³/s
- 02.08.1991 Abfluss: 52 m³/s
- 13.04.1994 Abfluss: 42,2 m³/s
- 02.03.1987 Abfluss: 39,8 m³/s
- 20.02.1999 Abfluss: 39,2 m³/s
| Date | Mean value [m³/s] | Maximum [m³/s] | Minimum [m³/s] |
|---|---|---|---|
| 31.12.2022 | 0.285 | 0.288 | 0.268 |
| 30.12.2022 | 0.289 | 0.311 | 0.288 |
| 29.12.2022 | 0.31 | 0.333 | 0.21 |
| 28.12.2022 | 0.351 | 0.382 | 0.333 |
| 27.12.2022 | 0.458 | 0.776 | 0.333 |
| 26.12.2022 | 0.465 | 0.558 | 0.435 |
| 25.12.2022 | 0.877 | 1.44 | 0.558 |
© Bayerisches Landesamt für Umwelt 2024